

Important moving averages we focus on, the pin bar (candlestick with a long lower wick), and the mBDSR (RCI two-filter) pullback-buy signal
Indicator that captures tops and bottoms using RCI in combination with its methods: 【mBDSR】
Methods and Case Studies (PDF) ★GogoJungle AWARD2020 Recipient★
https://www.gogojungle.co.jp/tools/indicators/11836
The above products include 301 PDFs. For a list of those PDFs’ titles and related information, please see the article below.
About the 301 PDF files included with 【BODSOR・mBDSR】
https://www.gogojungle.co.jp/finance/navi/articles/34271
Gold XAUUSD 15-minute chart
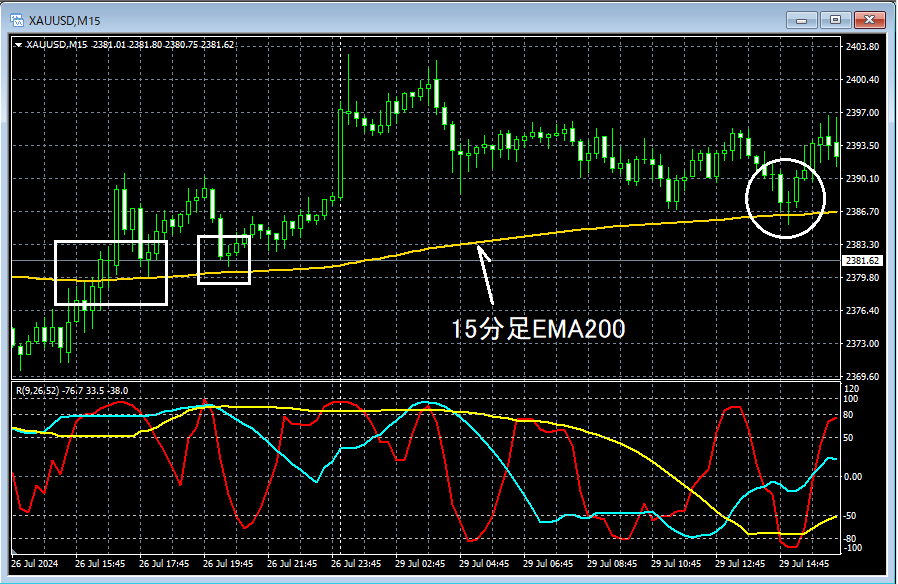
If you look at the area circled in white on the four-hour chart above, it has historically functioned as resistance and support15-minute EMA200and shows a potential upward movement when it drops near this levelPin Bar (long lower shadow candlestick)appears. It may not be strange to consider buying on dips on the lower timeframe.
Gold XAUUSD 1-minute chart
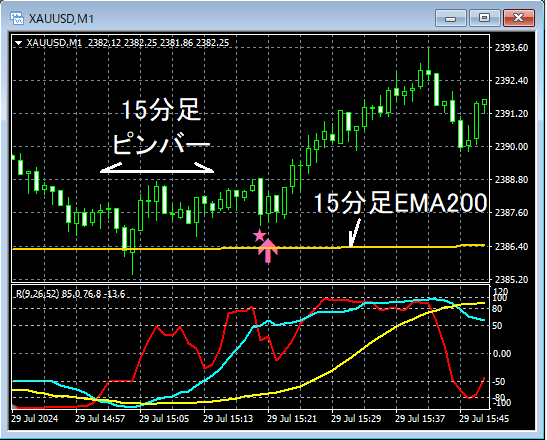
On the above 1-minute chart, in conjunction with thePin Bar (long lower shadow candlestick)appearance on the 15-minute chart, after the rise there is a dropmBDSR (two-filter RCI) buy signalthat lights up, and prices thereafter rise firmly.
From this example,a trading method focusing on moving averages and pin barsandmBDSR signalsshow strong compatibility.
Also, in this example,placing slightly below the recent lowallows for trades with good risk-reward ratios.
Indicator that excels in combination with RCI: 【BODSOR・mBDSR】
Methods and Case Studies (PDF) ★GogoJungle AWARD2020 Recipient★
https://www.gogojungle.co.jp/tools/indicators/11836
The PDF files included number 301 (over 1,000 pages, over 350,000 characters in total).
Most of them are about the following: using three RCI lines to logically link higher and lower timeframes, sequentially considering the状況s of multiple lower timeframes, and ultimately waiting for a pullback buying or pullback selling timing (i.e., mBDSR signals) on the lower timeframesThis is compiled as examples.
Additionally,many focus on capturing points where multiple entry justifications overlap.
The explanations useover 1,000 charts.

Methods and Case Studies (PDF) ★GogoJungle AWARD2020 Recipient★
https://www.gogojungle.co.jp/tools/indicators/11836
The above products include 301 PDFs. For a list of those PDFs’ titles and related information, please see the article below.
About the 301 PDF files included with 【BODSOR・mBDSR】
https://www.gogojungle.co.jp/finance/navi/articles/34271
Gold XAUUSD 15-minute chart
If you look at the area circled in white on the four-hour chart above, it has historically functioned as resistance and support15-minute EMA200and shows a potential upward movement when it drops near this levelPin Bar (long lower shadow candlestick)appears. It may not be strange to consider buying on dips on the lower timeframe.
Gold XAUUSD 1-minute chart
On the above 1-minute chart, in conjunction with thePin Bar (long lower shadow candlestick)appearance on the 15-minute chart, after the rise there is a dropmBDSR (two-filter RCI) buy signalthat lights up, and prices thereafter rise firmly.
From this example,a trading method focusing on moving averages and pin barsandmBDSR signalsshow strong compatibility.
Also, in this example,placing slightly below the recent lowallows for trades with good risk-reward ratios.
Indicator that excels in combination with RCI: 【BODSOR・mBDSR】
Methods and Case Studies (PDF) ★GogoJungle AWARD2020 Recipient★
https://www.gogojungle.co.jp/tools/indicators/11836
The PDF files included number 301 (over 1,000 pages, over 350,000 characters in total).
Most of them are about the following: using three RCI lines to logically link higher and lower timeframes, sequentially considering the状況s of multiple lower timeframes, and ultimately waiting for a pullback buying or pullback selling timing (i.e., mBDSR signals) on the lower timeframesThis is compiled as examples.
Additionally,many focus on capturing points where multiple entry justifications overlap.
The explanations useover 1,000 charts.
× ![]()


