

Sign of selling rallies near the important moving averages and R1R2S2 signals
Indicator that captures “bottoming and reversal” when combined with RCI: mBDSR
Method and Case Study (PDF) ★GogoJungle AWARD2020 winner★
https://www.gogojungle.co.jp/tools/indicators/11836
The above product includes 301 PDFs (methods, case studies, etc.). For a list of the titles of those PDFs, please see the article below.
Regarding the 301 PDF files included with [BODSOR・mBDSR]
https://www.gogojungle.co.jp/finance/navi/articles/34271
R1R2S2 is included in the product above. For details, please read the article below on Investment Navi+.
RCI Three-Line “Two-Stage Judgment” Indicator for Targeting Trend Reversals, Buy Dips, and Sell on Retracements – R1R2S2 Release!!
Below,we introduce examples of the signals ofR1R2S2
Pound-Dollar 5-minute Chart
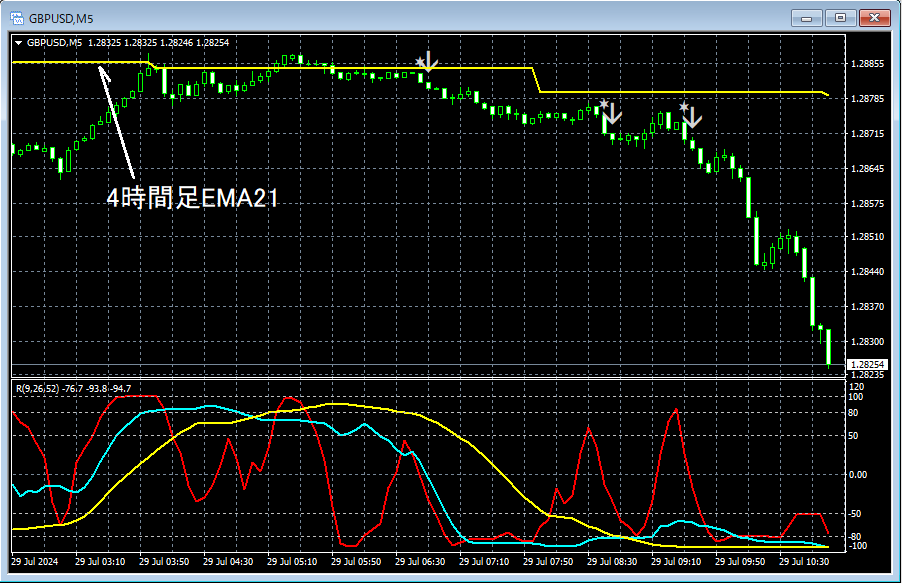
R1R2S2signals
The higher timeframe chart is omitted, but it is not surprising to consider a potential reversal drop around the4-hour EMA21area. On the 5-minute chart above,4-hour EMA21from near that area shows a down move in progress,R1R2S2reversal-sell signals light up three times.
An indicator that shines in combination with RCI: 【BODSOR・mBDSR】
Method and Case Study (PDF) ★GogoJungle AWARD2020 winner★
https://www.gogojungle.co.jp/tools/indicators/11836
The PDF files number 301 (over 1,000 pages in total, over 350,000 characters).
Most of them areexamples that lay out how to logically link higher and lower timeframes using the RCI three-line, sequentially analyzing multiple lower-timeframe conditions, and ultimately waiting for dip-buying or pullback-selling timing (i.e., the mBDSR signal) on the lower timeframe.
Also,many of them focus on identifying points where multiple entry reasons overlap.
In the explanations,more than 1,000 chartsare used.

Method and Case Study (PDF) ★GogoJungle AWARD2020 winner★
https://www.gogojungle.co.jp/tools/indicators/11836
The above product includes 301 PDFs (methods, case studies, etc.). For a list of the titles of those PDFs, please see the article below.
Regarding the 301 PDF files included with [BODSOR・mBDSR]
https://www.gogojungle.co.jp/finance/navi/articles/34271
R1R2S2 is included in the product above. For details, please read the article below on Investment Navi+.
RCI Three-Line “Two-Stage Judgment” Indicator for Targeting Trend Reversals, Buy Dips, and Sell on Retracements – R1R2S2 Release!!
Below,we introduce examples of the signals ofR1R2S2
Pound-Dollar 5-minute Chart
R1R2S2signals
The higher timeframe chart is omitted, but it is not surprising to consider a potential reversal drop around the4-hour EMA21area. On the 5-minute chart above,4-hour EMA21from near that area shows a down move in progress,R1R2S2reversal-sell signals light up three times.
An indicator that shines in combination with RCI: 【BODSOR・mBDSR】
Method and Case Study (PDF) ★GogoJungle AWARD2020 winner★
https://www.gogojungle.co.jp/tools/indicators/11836
The PDF files number 301 (over 1,000 pages in total, over 350,000 characters).
Most of them areexamples that lay out how to logically link higher and lower timeframes using the RCI three-line, sequentially analyzing multiple lower-timeframe conditions, and ultimately waiting for dip-buying or pullback-selling timing (i.e., the mBDSR signal) on the lower timeframe.
Also,many of them focus on identifying points where multiple entry reasons overlap.
In the explanations,more than 1,000 chartsare used.
× ![]()


