

[Attack with two indicators!!] Sign of R1R2S2 and mBDSR (RCI two-filter)
Indicator "RCI x mBDSR" capturing Tops and Bottoms with RCI combination
Methods & Case Studies (PDF) ★GogoJungle AWARD2020 winner★
https://www.gogojungle.co.jp/tools/indicators/11836
The above products include 301 PDFs (methods, case studies, etc.). For a list of the PDF titles, please refer to the article below.
About the 301 accompanying PDF files for 【BODSOR・mBDSR】
https://www.gogojungle.co.jp/finance/navi/articles/34271
R1R2S2 is included in the product above. For details, please see the article below in Investment Navigator+.
RCI triple-line release: "R1R2S2" indicator to target trend reversals, pullbacks, and returns!!
Below,mBDSR (RCI two-line filter)andR1R2S2signs are shown simultaneously in an example.
Bitcoin / US Dollar BTCUSD 30-minute chart
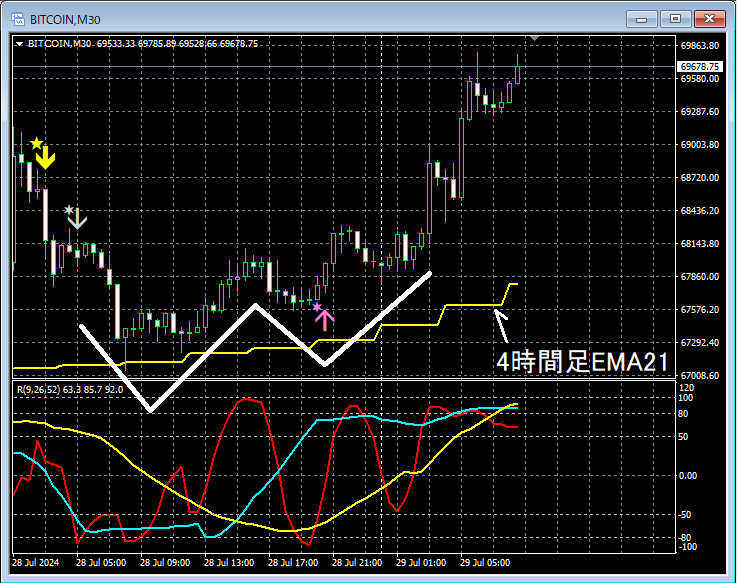
mBDSR (RCI two-line filter)andR1R2S2signs
The higher timeframe context is omitted.Near the 4-hour EMA21area, a reversal and bounce could be plausible. On the 30-minute chart above,mBDSR (RCI two-line filter) and R1R2S2show a pullback selling signal and have fallen to the4-hour EMA21level. After that,a double bottomformed and rose. The timing of the start of the rise at the right-side trough of thedouble bottomwas well captured by the pullback buy signal ofR1R2S2.
Indicator "BODSOR・mBDSR" that shines in combination with RCI
Methods & Case Studies (PDF) ★GogoJungle AWARD2020 winner★
https://www.gogojungle.co.jp/tools/indicators/11836
The PDFs include 301 files (over 1,000 pages, over 350,000 characters in total).
Many of them are composed as examples that logically link higher and lower timeframes by using three RCI lines, sequentially examining multiple lower-timeframe conditions, and ultimately waiting for pullback buys or pullback sells on the lower timeframe (i.e., the signals of mBDSR).
In addition,many focus on capturing points where multiple entry reasons overlap..
In the explanations,more than 1,000 chartsare used.

Methods & Case Studies (PDF) ★GogoJungle AWARD2020 winner★
https://www.gogojungle.co.jp/tools/indicators/11836
The above products include 301 PDFs (methods, case studies, etc.). For a list of the PDF titles, please refer to the article below.
About the 301 accompanying PDF files for 【BODSOR・mBDSR】
https://www.gogojungle.co.jp/finance/navi/articles/34271
R1R2S2 is included in the product above. For details, please see the article below in Investment Navigator+.
RCI triple-line release: "R1R2S2" indicator to target trend reversals, pullbacks, and returns!!
Below,mBDSR (RCI two-line filter)andR1R2S2signs are shown simultaneously in an example.
Bitcoin / US Dollar BTCUSD 30-minute chart
mBDSR (RCI two-line filter)andR1R2S2signs
The higher timeframe context is omitted.Near the 4-hour EMA21area, a reversal and bounce could be plausible. On the 30-minute chart above,mBDSR (RCI two-line filter) and R1R2S2show a pullback selling signal and have fallen to the4-hour EMA21level. After that,a double bottomformed and rose. The timing of the start of the rise at the right-side trough of thedouble bottomwas well captured by the pullback buy signal ofR1R2S2.
Indicator "BODSOR・mBDSR" that shines in combination with RCI
Methods & Case Studies (PDF) ★GogoJungle AWARD2020 winner★
https://www.gogojungle.co.jp/tools/indicators/11836
The PDFs include 301 files (over 1,000 pages, over 350,000 characters in total).
Many of them are composed as examples that logically link higher and lower timeframes by using three RCI lines, sequentially examining multiple lower-timeframe conditions, and ultimately waiting for pullback buys or pullback sells on the lower timeframe (i.e., the signals of mBDSR).
In addition,many focus on capturing points where multiple entry reasons overlap..
In the explanations,more than 1,000 chartsare used.
× ![]()


