

[Dollar-Yen Strategy] Targeting the rebound after breaking the recent low! mBDSR (RCI 2-band filter) Signal from last Friday's chart
0
Indicator 【mBDSR】 that captures “tops and bottoms and reversals” in combination with RCI
and method・case studies (PDF) ★GogoJungle AWARD2020 winner★
https://www.gogojungle.co.jp/tools/indicators/11836
The above products include 301 PDFs. For the list of titles of those PDFs, please refer to the article below.
About the 301 PDF files included with 【BODSOR・mBDSR】
https://www.gogojungle.co.jp/finance/navi/articles/34271
Dollar/Yen 5-minute chart
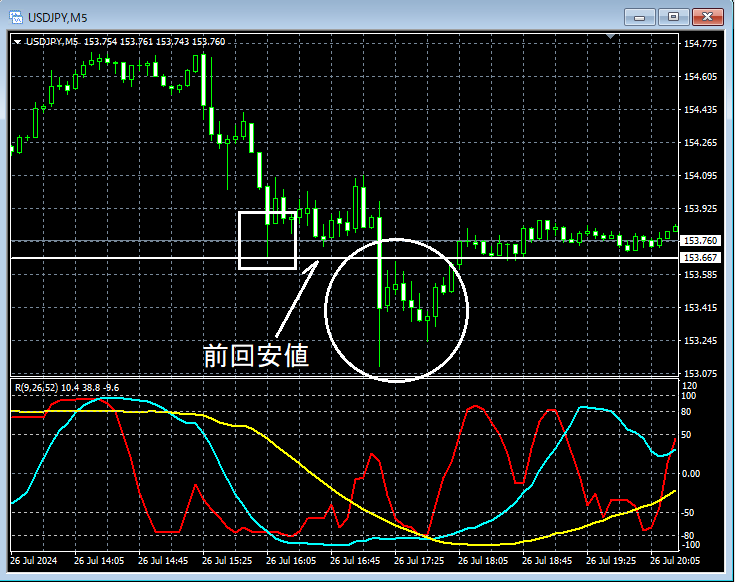
Looking at the area circled in white on the 5-minute chart above,the recent lowshave been penetrated to the downside. We will examine it in more detail on a lower time frame.
Dollar/Yen 1-minute chart
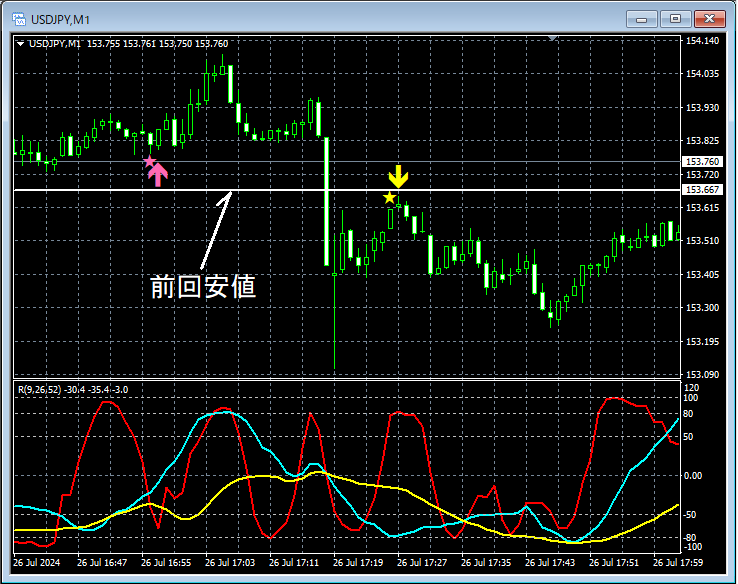
On the 1-minute chart above,a line indicating the recent lowswas broken to the downside, and around that line it rose,mBDSR (Filter: RCI26 and RCI52) sell signallit up, and immediately after, the price declined firmly.
From this example,a trading method focusing on breaking recent lowsand thesignals of mBDSRshow a strong compatibility.
Indicator 【BODSOR・mBDSR】 that shows power when combined with RCI
and method・case studies (PDF) ★GogoJungle AWARD2020 winner★
https://www.gogojungle.co.jp/tools/indicators/11836
The PDF files included are 301 in total (over 1,000 pages, over 350,000 characters).
Many of them areexamples that logically link multiple time frames by using the three RCI lines, examining the conditions of higher and lower time frames in sequence, and ultimately waiting for a timing to buy on dips or to sell on rallies (i.e., the signals of mBDSR) on the lower time frame.
Also,many of them focus on identifying points where multiple entry criteria overlap.
In the explanations,more than 1,000 chartsare used.

and method・case studies (PDF) ★GogoJungle AWARD2020 winner★
https://www.gogojungle.co.jp/tools/indicators/11836
The above products include 301 PDFs. For the list of titles of those PDFs, please refer to the article below.
About the 301 PDF files included with 【BODSOR・mBDSR】
https://www.gogojungle.co.jp/finance/navi/articles/34271
Dollar/Yen 5-minute chart
Looking at the area circled in white on the 5-minute chart above,the recent lowshave been penetrated to the downside. We will examine it in more detail on a lower time frame.
Dollar/Yen 1-minute chart
On the 1-minute chart above,a line indicating the recent lowswas broken to the downside, and around that line it rose,mBDSR (Filter: RCI26 and RCI52) sell signallit up, and immediately after, the price declined firmly.
From this example,a trading method focusing on breaking recent lowsand thesignals of mBDSRshow a strong compatibility.
Indicator 【BODSOR・mBDSR】 that shows power when combined with RCI
and method・case studies (PDF) ★GogoJungle AWARD2020 winner★
https://www.gogojungle.co.jp/tools/indicators/11836
The PDF files included are 301 in total (over 1,000 pages, over 350,000 characters).
Many of them areexamples that logically link multiple time frames by using the three RCI lines, examining the conditions of higher and lower time frames in sequence, and ultimately waiting for a timing to buy on dips or to sell on rallies (i.e., the signals of mBDSR) on the lower time frame.
Also,many of them focus on identifying points where multiple entry criteria overlap.
In the explanations,more than 1,000 chartsare used.
× ![]()


