

【Even on long time frames...】Sell signal on retracement using the upper-timeframe pin bar, double top, neck line, and mBDSR (RCI 2-filter)
Indicator that captures “bottoms, reversals” in combination with RCI: [mBDSR]
and method & case studies (PDF) ★GogoJungle AWARD2020 winner★
https://www.gogojungle.co.jp/tools/indicators/11836
The above product includes 301 PDFs. For a list of the PDF titles and other details, please refer to the article below.
About the 301 PDF files included with 【BODSOR・mBDSR】
https://www.gogojungle.co.jp/finance/navi/articles/34271
NZDCAD Weekly
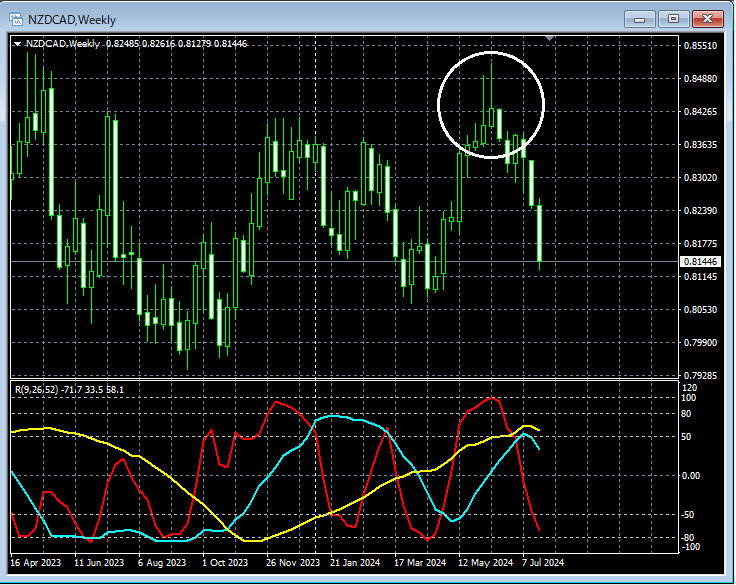
Looking at the weekly chart above circled by a white circle, it suggests a downtrendPin Bar (long upper shadow candle)appears two times in succession. It may not be unusual to consider selling on rallies on lower timeframes.
NZDCAD Daily
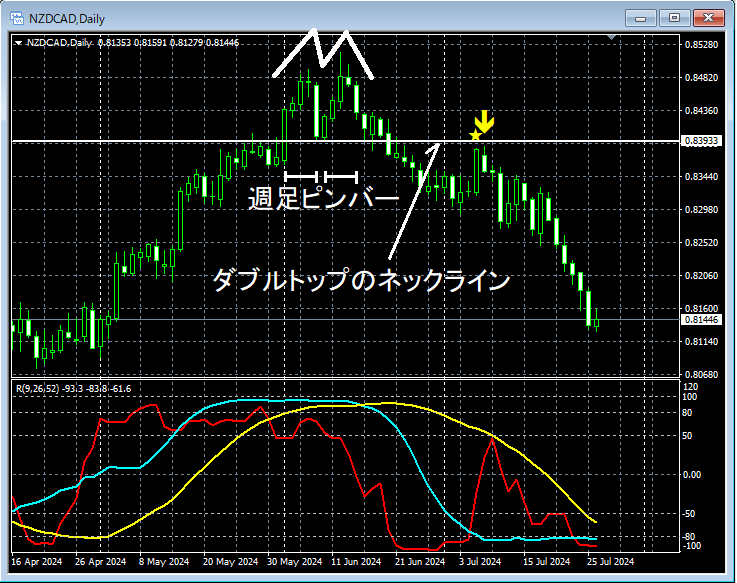
On the daily chart above, in the weekly chartPin Bar (long lower shadow candle)appears andDouble TopDouble Top Necklineis formed and descending. Subsequently,was approachedmBDSR (Filter: RCI26 and RCI52) Sell signallights up and the price drops sharply.
From this example,trading techniques focusing on Pin Bars (long upper shadows) or Double Tops and their necklineandmBDSR signalsshow strong compatibility.
Indicators that excel in combination with RCI: 【BODSOR・mBDSR】
and method & case studies (PDF) ★GogoJungle AWARD2020 winner★
https://www.gogojungle.co.jp/tools/indicators/11836
The PDF files include 301 documents (over 1,000 pages in total, over 350,000 characters).
Many of them are dedicated to the approach of logically linking multiple higher and lower timeframes using three RCI lines, and ultimately detailing how to wait for pullbacks or downside retracements on the lower timeframes (i.e., the mBDSR signals).In other words, they summarize examples that demonstrate this approach.
Additionally,many focus on identifying points where multiple entry justifications overlapas their emphasis.
For explanations,more than 1,000 chartsare used.

and method & case studies (PDF) ★GogoJungle AWARD2020 winner★
https://www.gogojungle.co.jp/tools/indicators/11836
The above product includes 301 PDFs. For a list of the PDF titles and other details, please refer to the article below.
About the 301 PDF files included with 【BODSOR・mBDSR】
https://www.gogojungle.co.jp/finance/navi/articles/34271
NZDCAD Weekly
Looking at the weekly chart above circled by a white circle, it suggests a downtrendPin Bar (long upper shadow candle)appears two times in succession. It may not be unusual to consider selling on rallies on lower timeframes.
NZDCAD Daily
On the daily chart above, in the weekly chartPin Bar (long lower shadow candle)appears andDouble TopDouble Top Necklineis formed and descending. Subsequently,was approachedmBDSR (Filter: RCI26 and RCI52) Sell signallights up and the price drops sharply.
From this example,trading techniques focusing on Pin Bars (long upper shadows) or Double Tops and their necklineandmBDSR signalsshow strong compatibility.
Indicators that excel in combination with RCI: 【BODSOR・mBDSR】
and method & case studies (PDF) ★GogoJungle AWARD2020 winner★
https://www.gogojungle.co.jp/tools/indicators/11836
The PDF files include 301 documents (over 1,000 pages in total, over 350,000 characters).
Many of them are dedicated to the approach of logically linking multiple higher and lower timeframes using three RCI lines, and ultimately detailing how to wait for pullbacks or downside retracements on the lower timeframes (i.e., the mBDSR signals).In other words, they summarize examples that demonstrate this approach.
Additionally,many focus on identifying points where multiple entry justifications overlapas their emphasis.
For explanations,more than 1,000 chartsare used.
× ![]()


