

【Gold Strategy】Reverse Head and Shoulders neckline and mBDSR (RCI2-band filter) signals from the XAUUSD chart of the day before yesterday (July 26, 2024)
0
Indicator 【mBDSR】 that captures “tops/bottoms and reversals” in combination with RCI
Methods and case studies (PDF) ★GogoJungle AWARD2020 winner★
https://www.gogojungle.co.jp/tools/indicators/11836
The above products include 301 PDFs. For a list of the titles of those PDFs, please refer to the article below.
About the 301 PDF files included with 【BODSOR・mBDSR】
https://www.gogojungle.co.jp/finance/navi/articles/34271
Gold XAUUSD 1-minute chart
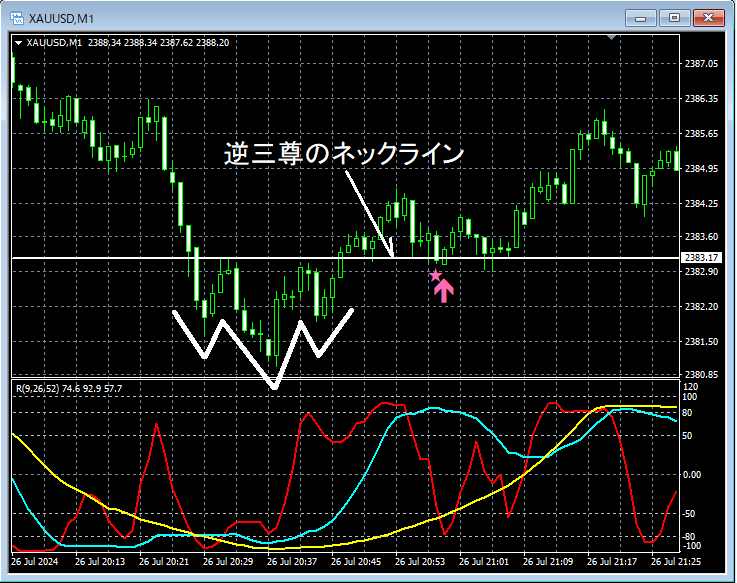
Obvious context from the higher timeframe is omitted. On the 1-minute chart above,the neck line of the head-and-shoulders patternis approached and thenthe mBDSR pullback buy signal (Filter: RCI26 and RCI52) lights up, after which price rises firmly.
From this example,a trading method that focuses on the head-and-shoulders pattern and its neck lineandthe signals of mBDSRshow a high degree of compatibility.
Indicator 【BODSOR・mBDSR】 that shines in combination with RCI
Methods and case studies (PDF) ★GogoJungle AWARD2020 winner★
https://www.gogojungle.co.jp/tools/indicators/11836
The PDF files include 301 PDFs (over 1,000 pages, over 350,000 characters in total).
Many of them are abouthow to logically link higher and lower timeframes using the three RCI lines, sequentially examining the conditions of multiple lower timeframes, and finally waiting for pullbacks in the lower timeframe or selling into rallies (i.e., mBDSR signals)as described.
Also,many focus on points where multiple entry reasons overlap.
In the explanations,more than 1,000 chartsare used.

Methods and case studies (PDF) ★GogoJungle AWARD2020 winner★
https://www.gogojungle.co.jp/tools/indicators/11836
The above products include 301 PDFs. For a list of the titles of those PDFs, please refer to the article below.
About the 301 PDF files included with 【BODSOR・mBDSR】
https://www.gogojungle.co.jp/finance/navi/articles/34271
Gold XAUUSD 1-minute chart
Obvious context from the higher timeframe is omitted. On the 1-minute chart above,the neck line of the head-and-shoulders patternis approached and thenthe mBDSR pullback buy signal (Filter: RCI26 and RCI52) lights up, after which price rises firmly.
From this example,a trading method that focuses on the head-and-shoulders pattern and its neck lineandthe signals of mBDSRshow a high degree of compatibility.
Indicator 【BODSOR・mBDSR】 that shines in combination with RCI
Methods and case studies (PDF) ★GogoJungle AWARD2020 winner★
https://www.gogojungle.co.jp/tools/indicators/11836
The PDF files include 301 PDFs (over 1,000 pages, over 350,000 characters in total).
Many of them are abouthow to logically link higher and lower timeframes using the three RCI lines, sequentially examining the conditions of multiple lower timeframes, and finally waiting for pullbacks in the lower timeframe or selling into rallies (i.e., mBDSR signals)as described.
Also,many focus on points where multiple entry reasons overlap.
In the explanations,more than 1,000 chartsare used.
× ![]()


