

【Gold Strategy】Sign of the Double Bottom and mBDSR (RCI2-Filter) at the Neckline of the Double Bottom, from the XAUUSD chart of the day before yesterday (July 26, 2024)
0
Indicator "Capture Troughs and Reversals" in combination with RCI【mBDSR】
Methods, Case Studies (PDF) ★GogoJungle AWARD 2020 Winner★
https://www.gogojungle.co.jp/tools/indicators/11836
The above products include 301 PDF files. For a list of their PDF titles, please refer to the article below.
About the 301 PDF files accompanying 【BODSOR・mBDSR】
https://www.gogojungle.co.jp/finance/navi/articles/34271
Gold XAUUSD 15-min chart
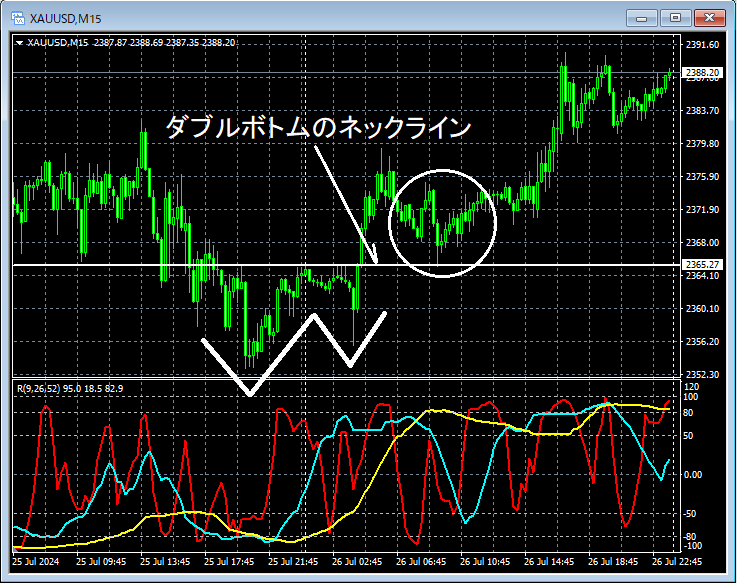
Looking at the area circled in white on the 15-minute chart above,the neck line of the double bottomhas been reached and price has dropped to around there, making it not unusual to consider a dip-buy. We will look for signs of upward movement on lower timeframes.
Gold XAUUSD 5-minute chart
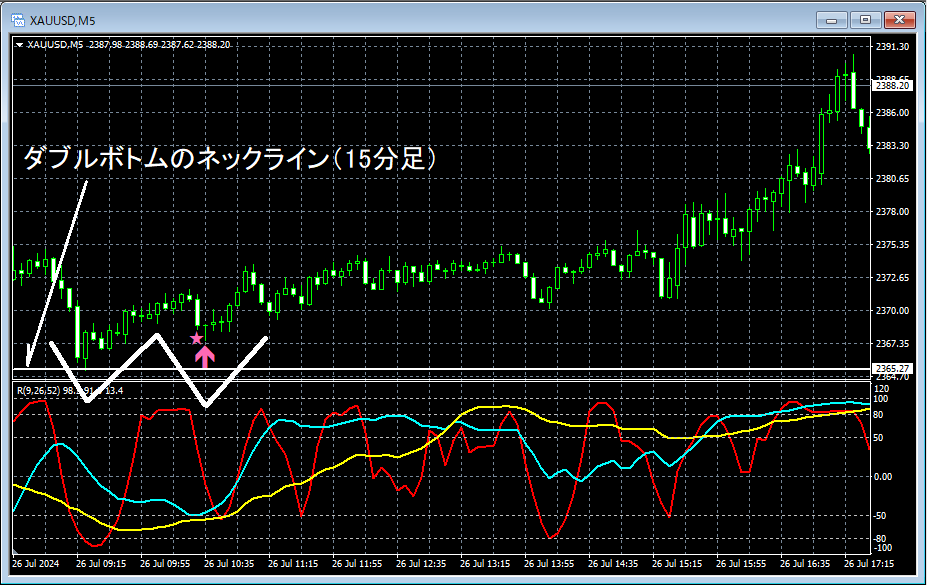
On the 5-minute chart above,the neck line of the 15-minute double bottomhas been reached anda double bottomis forming and rising.The right peak of the double bottomis a moment where the upward move beginsmBDSR (Filter: RCI26 and RCI52) pullback-buy signalhas been well captured.
From this example,a trading method focusing on double bottoms and their neck linesand thesynergy with mBDSR signalsis evident.
Indicator that shines in combination with RCI: 【BODSOR・mBDSR】
Methods, Case Studies (PDF) ★GogoJungle AWARD 2020 Winner★
https://www.gogojungle.co.jp/tools/indicators/11836
The PDF files amount to 301 (over 1,000 pages in total, over 350,000 characters).
Many of them are compiled as examples that logically link higher and lower timeframes using three RCI lines, progressively examining multiple lower-timeframe situations and ultimately waiting for pullback-buy or neutral-sell timing on the lower timeframe (i.e., the mBDSR signal).Additionally,
many focus on identifying points where multiple entry reasons overlap..
The explanations employmore than 1,000 charts.

Methods, Case Studies (PDF) ★GogoJungle AWARD 2020 Winner★
https://www.gogojungle.co.jp/tools/indicators/11836
The above products include 301 PDF files. For a list of their PDF titles, please refer to the article below.
About the 301 PDF files accompanying 【BODSOR・mBDSR】
https://www.gogojungle.co.jp/finance/navi/articles/34271
Gold XAUUSD 15-min chart
Looking at the area circled in white on the 15-minute chart above,the neck line of the double bottomhas been reached and price has dropped to around there, making it not unusual to consider a dip-buy. We will look for signs of upward movement on lower timeframes.
Gold XAUUSD 5-minute chart
On the 5-minute chart above,the neck line of the 15-minute double bottomhas been reached anda double bottomis forming and rising.The right peak of the double bottomis a moment where the upward move beginsmBDSR (Filter: RCI26 and RCI52) pullback-buy signalhas been well captured.
From this example,a trading method focusing on double bottoms and their neck linesand thesynergy with mBDSR signalsis evident.
Indicator that shines in combination with RCI: 【BODSOR・mBDSR】
Methods, Case Studies (PDF) ★GogoJungle AWARD 2020 Winner★
https://www.gogojungle.co.jp/tools/indicators/11836
The PDF files amount to 301 (over 1,000 pages in total, over 350,000 characters).
Many of them are compiled as examples that logically link higher and lower timeframes using three RCI lines, progressively examining multiple lower-timeframe situations and ultimately waiting for pullback-buy or neutral-sell timing on the lower timeframe (i.e., the mBDSR signal).Additionally,
many focus on identifying points where multiple entry reasons overlap..
The explanations employmore than 1,000 charts.
× ![]()


