

Push-Back Buying on the Moving Average We Are Important About and mBDSR (RCI Two-Filter)
0
Indicator that captures the bottom/top reversal in combination with RCI: 【mBDSR】
Methods and Case Studies (PDF) ★GogoJungle AWARD 2020 Winner★
https://www.gogojungle.co.jp/tools/indicators/11836
The above products include 301 PDFs. For a list of the PDFs titles and other details, please refer to the article below.
About the 301 PDF files included with 【BODSOR・mBDSR】
https://www.gogojungle.co.jp/finance/navi/articles/34271
Pound Aussie 4-hour chart
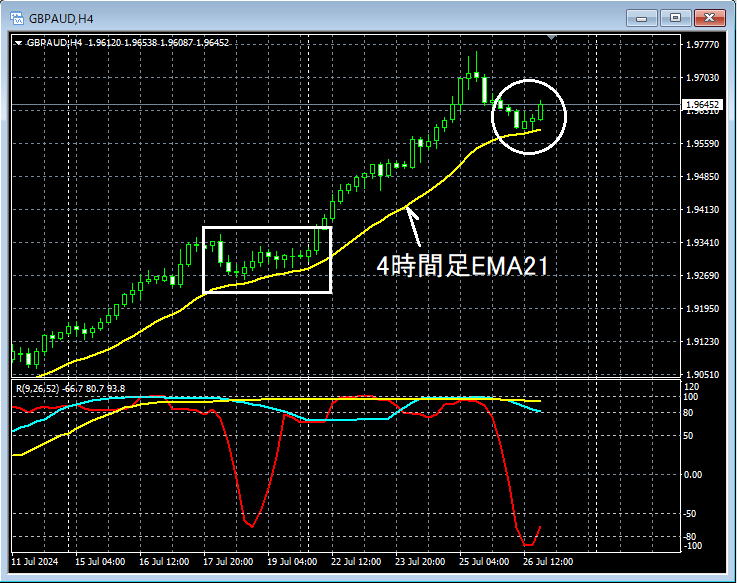
Looking at the area circled by the white circle on the 4-hour chart above, it previously served as support4-hour EMA21has fallen toward it, so a pullback buying scenario might not be unusual. We will look for signs of a price rise on lower timeframes.
Pound-Australian Dollar 30-minute chart
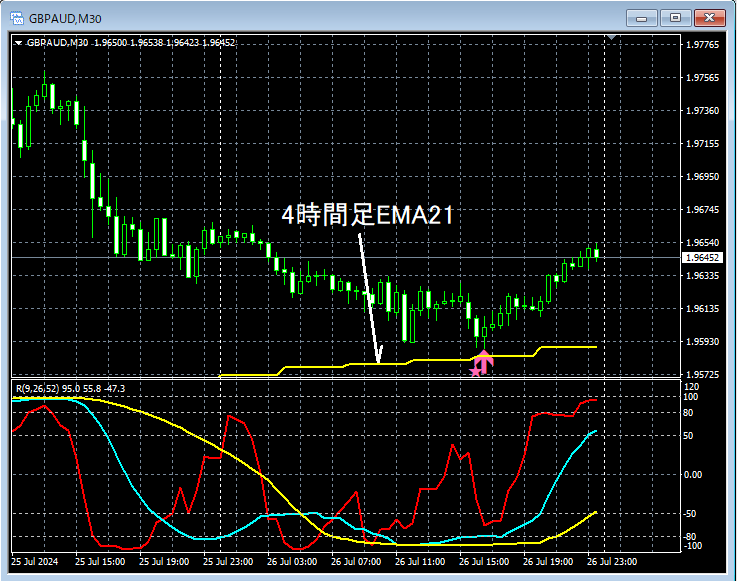
On the 30-minute chart above,4-hour EMA21has descended toward the vicinity ofmBDSR (Filter: RCI26 and RCI52) pullback buy signallights up, and price is rising solidly.
From this example,a trading approach that targets pullbacks near moving averagesandthe signals of mBDSRshow a strong compatibility.
Indicator that shines in combination with RCI: 【BODSOR・mBDSR】
Methods and Case Studies (PDF) ★GogoJungle AWARD2020 Winner★
https://www.gogojungle.co.jp/tools/indicators/11836
PDF files include 301 PDFs (over 1,000 pages, over 350,000 characters in total).
Many of them are summarized as follows: by logically linking multiple timeframes using three lines of RCI, examining the conditions of several lower timeframes sequentially, and ultimately waiting for pullbacks on the lower timeframe (i.e., the mBDSR signals)to form a complete example.
Also,many entries focus on identifying points where multiple entry reasons overlapas well.
In the explanations,over 1,000 chartsare used.

Methods and Case Studies (PDF) ★GogoJungle AWARD 2020 Winner★
https://www.gogojungle.co.jp/tools/indicators/11836
The above products include 301 PDFs. For a list of the PDFs titles and other details, please refer to the article below.
About the 301 PDF files included with 【BODSOR・mBDSR】
https://www.gogojungle.co.jp/finance/navi/articles/34271
Pound Aussie 4-hour chart
Looking at the area circled by the white circle on the 4-hour chart above, it previously served as support4-hour EMA21has fallen toward it, so a pullback buying scenario might not be unusual. We will look for signs of a price rise on lower timeframes.
Pound-Australian Dollar 30-minute chart
On the 30-minute chart above,4-hour EMA21has descended toward the vicinity ofmBDSR (Filter: RCI26 and RCI52) pullback buy signallights up, and price is rising solidly.
From this example,a trading approach that targets pullbacks near moving averagesandthe signals of mBDSRshow a strong compatibility.
Indicator that shines in combination with RCI: 【BODSOR・mBDSR】
Methods and Case Studies (PDF) ★GogoJungle AWARD2020 Winner★
https://www.gogojungle.co.jp/tools/indicators/11836
PDF files include 301 PDFs (over 1,000 pages, over 350,000 characters in total).
Many of them are summarized as follows: by logically linking multiple timeframes using three lines of RCI, examining the conditions of several lower timeframes sequentially, and ultimately waiting for pullbacks on the lower timeframe (i.e., the mBDSR signals)to form a complete example.
Also,many entries focus on identifying points where multiple entry reasons overlapas well.
In the explanations,over 1,000 chartsare used.
× ![]()


