

Top pin bar (candlestick with a long lower wick) and mBDSR (RCI2-bar filter) pullback buy signal
Indicator that captures “top and bottom reversals” in combination with RCI: [mBDSR]
Methods and Case Studies (PDF) ★GogoJungle AWARD2020 Winner★
https://www.gogojungle.co.jp/tools/indicators/11836
The above products include 301 PDFs. For lists such as the titles of those PDFs, please see the article below.
About the 301 PDF files included with 【BODSOR・mBDSR】
https://www.gogojungle.co.jp/finance/navi/articles/34271
CADCHF 4-hour chart
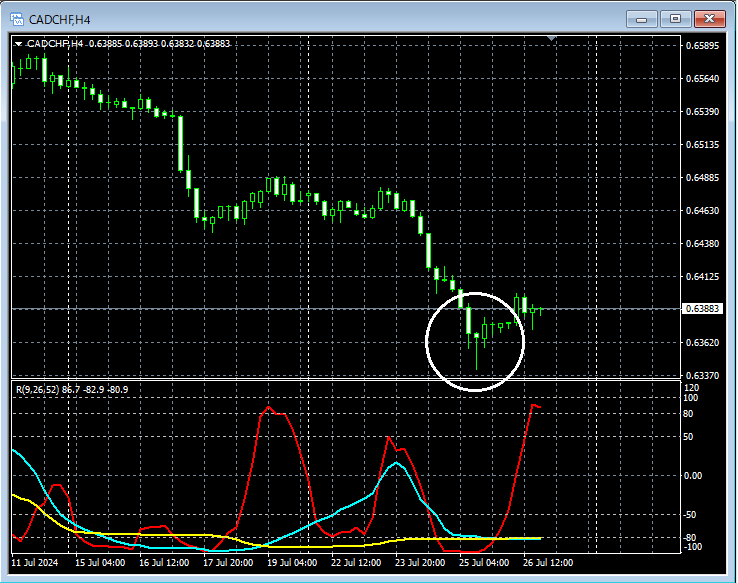
If you look at the area circled in white in the 4-hour chart above, it suggests a risePin Bar (long lower wick)appears. It may not be strange to consider a pullback buy on lower timeframes.
CADCHF 30-minute chart
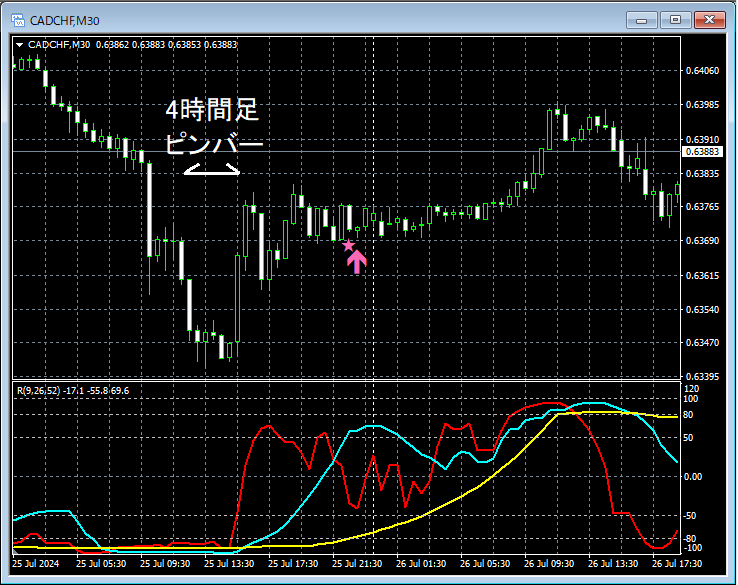
In the upper 30-minute chart, on the four-hour chartPin Bar (long lower wick)appears, followed by a rise,mBDSR (Filter: RCI26 and RCI52) pullback buy signallights up and the price clearly rises.
From this example,the trading method focusing on Pin Bars (long lower wick)andthe signals of mBDSRappear to be highly compatible.
Indicator that shines when combined with RCI: 【BODSOR・mBDSR】
Methods and Case Studies (PDF) ★GogoJungle AWARD2020 Winner★
https://www.gogojungle.co.jp/tools/indicators/11836
The PDF files include 301 items (over 1,000 pages, over 350,000 characters in total).
Most of them aresummaries that logically link higher and lower timeframes using the RCI three-line setup, and then consider the situations of multiple lower timeframes sequentially, ultimately waiting for the pullback buy or retracement sell timing on the lower timeframes (i.e., mBDSR signals)as examples.
Also,many of them focus on capturing points where multiple entry reasons coincide.
In the explanations,more than 1,000 chartsare used.

Methods and Case Studies (PDF) ★GogoJungle AWARD2020 Winner★
https://www.gogojungle.co.jp/tools/indicators/11836
The above products include 301 PDFs. For lists such as the titles of those PDFs, please see the article below.
About the 301 PDF files included with 【BODSOR・mBDSR】
https://www.gogojungle.co.jp/finance/navi/articles/34271
CADCHF 4-hour chart
If you look at the area circled in white in the 4-hour chart above, it suggests a risePin Bar (long lower wick)appears. It may not be strange to consider a pullback buy on lower timeframes.
CADCHF 30-minute chart
In the upper 30-minute chart, on the four-hour chartPin Bar (long lower wick)appears, followed by a rise,mBDSR (Filter: RCI26 and RCI52) pullback buy signallights up and the price clearly rises.
From this example,the trading method focusing on Pin Bars (long lower wick)andthe signals of mBDSRappear to be highly compatible.
Indicator that shines when combined with RCI: 【BODSOR・mBDSR】
Methods and Case Studies (PDF) ★GogoJungle AWARD2020 Winner★
https://www.gogojungle.co.jp/tools/indicators/11836
The PDF files include 301 items (over 1,000 pages, over 350,000 characters in total).
Most of them aresummaries that logically link higher and lower timeframes using the RCI three-line setup, and then consider the situations of multiple lower timeframes sequentially, ultimately waiting for the pullback buy or retracement sell timing on the lower timeframes (i.e., mBDSR signals)as examples.
Also,many of them focus on capturing points where multiple entry reasons coincide.
In the explanations,more than 1,000 chartsare used.
× ![]()


