

Intriguing horizon line and the pin bar on the higher timeframe with an mBDSR (RCI2-band filter) pullback buying signal
0
Indicator that captures “top-bottom reversal” in combination with RCI【mBDSR】
Methods & Case Studies (PDF) ★GogoJungle AWARD2020 winner★
https://www.gogojungle.co.jp/tools/indicators/11836
The above products include 301 PDFs. For a list of the PDF titles and other details, please see the article below.
About the 301 PDF files included with 【BODSOR・mBDSR】
https://www.gogojungle.co.jp/finance/navi/articles/34271
AUDCHF AUDCHF Japanese Day
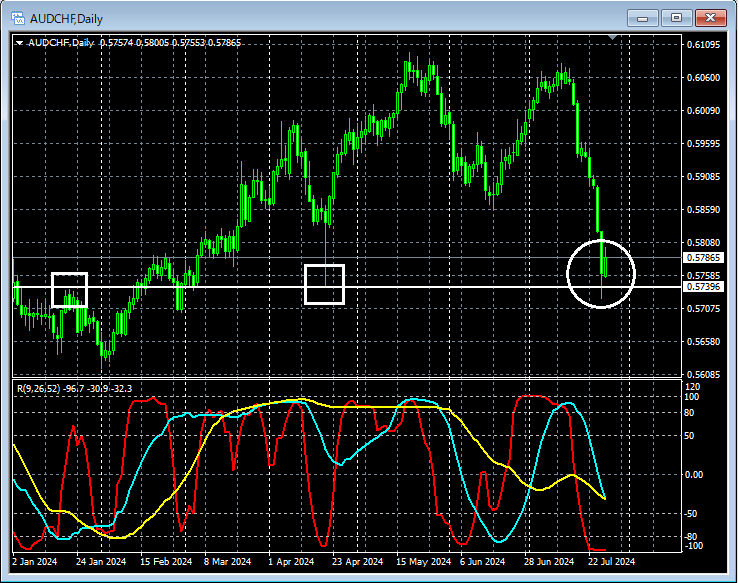
Looking at the area circled in white on the daily chart above, in the pastthere were lines that acted as resistance or supportand we are watching whether this line will function as support.
AUDCHF AUDCHF 4-hour
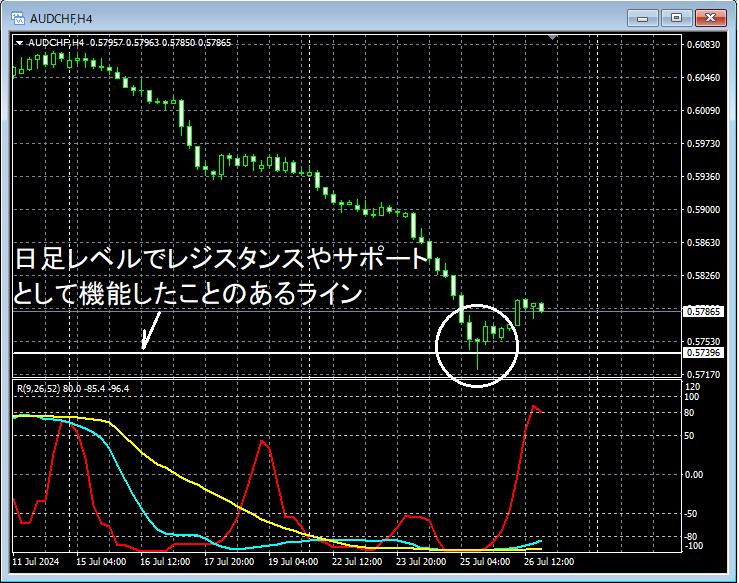
From the area circled in white on the 4-hour chart above,a line that has functioned as resistance or support on the daily chartis nearby and appears to indicate a potential risePin bar (long lower wick)has appeared. It might not be unreasonable to consider buying on dips on lower timeframes.
AUDCHF AUDCHF 1-hour
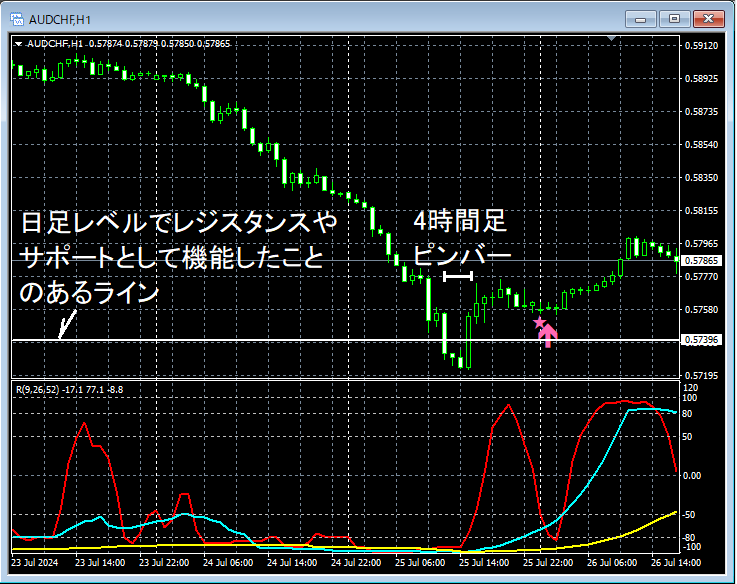
On the 1-hour chart above, following the appearance ofPin bar (long lower wick)on the 4-hour chart,the mBDSR (two RCI filters) buy-the-dip signallights up and price rises firmly.
From this example,a trading method focusing on notable horizontal lines and pin bars (long lower wick)and theaffinity with the mBDSR signalbecomes evident.
Indicator that excels in combination with RCI: 【BODSOR・mBDSR】
Methods & Case Studies (PDF) ★GogoJungle AWARD2020 winner★
https://www.gogojungle.co.jp/tools/indicators/11836
The PDF files include 301 PDFs (over 1,000 pages, over 350,000 characters in total).
Many of them are built around the idea of linking higher and lower timeframes logically using three RCI lines to examine multiple lower timeframes sequentially, ultimately waiting for pullbacks on the lower timeframes (i.e., signals from mBDSR).
Additionally,many focus on capturing points where multiple entry criteria overlapis emphasized.
Descriptions useover 1,000 chartsin total.

Methods & Case Studies (PDF) ★GogoJungle AWARD2020 winner★
https://www.gogojungle.co.jp/tools/indicators/11836
The above products include 301 PDFs. For a list of the PDF titles and other details, please see the article below.
About the 301 PDF files included with 【BODSOR・mBDSR】
https://www.gogojungle.co.jp/finance/navi/articles/34271
AUDCHF AUDCHF Japanese Day
Looking at the area circled in white on the daily chart above, in the pastthere were lines that acted as resistance or supportand we are watching whether this line will function as support.
AUDCHF AUDCHF 4-hour
From the area circled in white on the 4-hour chart above,a line that has functioned as resistance or support on the daily chartis nearby and appears to indicate a potential risePin bar (long lower wick)has appeared. It might not be unreasonable to consider buying on dips on lower timeframes.
AUDCHF AUDCHF 1-hour
On the 1-hour chart above, following the appearance ofPin bar (long lower wick)on the 4-hour chart,the mBDSR (two RCI filters) buy-the-dip signallights up and price rises firmly.
From this example,a trading method focusing on notable horizontal lines and pin bars (long lower wick)and theaffinity with the mBDSR signalbecomes evident.
Indicator that excels in combination with RCI: 【BODSOR・mBDSR】
Methods & Case Studies (PDF) ★GogoJungle AWARD2020 winner★
https://www.gogojungle.co.jp/tools/indicators/11836
The PDF files include 301 PDFs (over 1,000 pages, over 350,000 characters in total).
Many of them are built around the idea of linking higher and lower timeframes logically using three RCI lines to examine multiple lower timeframes sequentially, ultimately waiting for pullbacks on the lower timeframes (i.e., signals from mBDSR).
Additionally,many focus on capturing points where multiple entry criteria overlapis emphasized.
Descriptions useover 1,000 chartsin total.
× ![]()


