

Pin Bar of the Upper Foot (candlestick with a long lower wick) and mBDSR (RCI two-filter) signals
0
Indicator that captures the bottom and reversal in combination with RCI: 【mBDSR】
Methods and Case Studies (PDF) ★GogoJungle AWARD2020 Winner★
https://www.gogojungle.co.jp/tools/indicators/11836
The above product includes 301 PDFs. For a list of the titles of those PDFs, please see the article below.
Regarding the 301 PDF files included with 【BODSOR・mBDSR】
https://www.gogojungle.co.jp/finance/navi/articles/34271
USD/CHF 4-hour chart
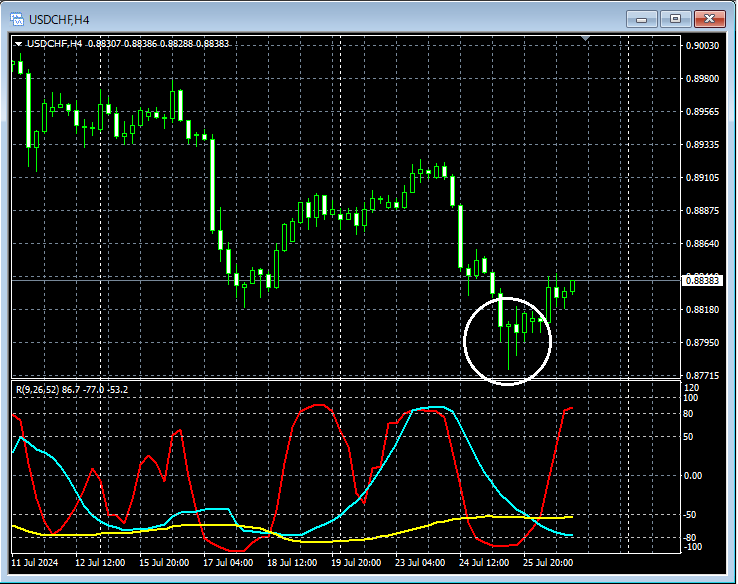
If you look around the area circled in white on the 4-hour chart above, it suggests an uptrendPin Bar (long lower shadow)appears. It may not be surprising to consider buying on dips on lower timeframes.
USD/CHF 1-hour chart
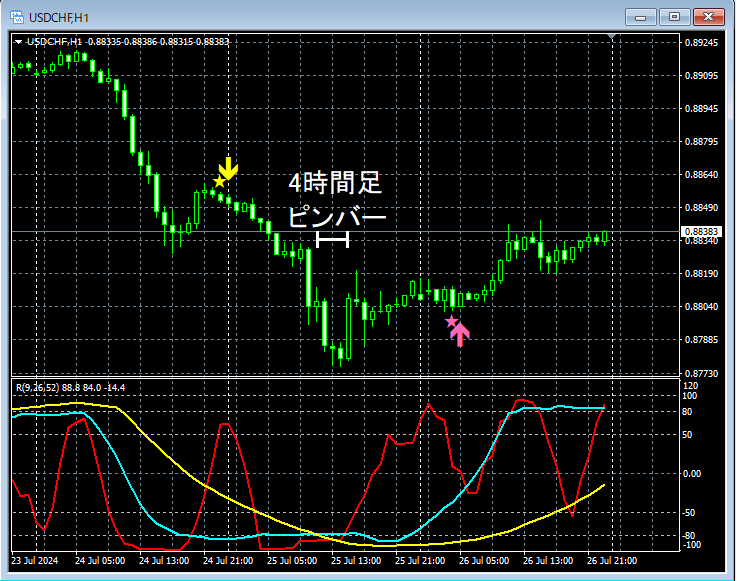
On the higher 1-hour chart,Pin Bar (long lower shadow)appearing is followed by an ascent,mBDSR (filter: RCI26 and RCI52) pullback buy signallights up and the price rises firmly.
USD/CHF 15-minute chart
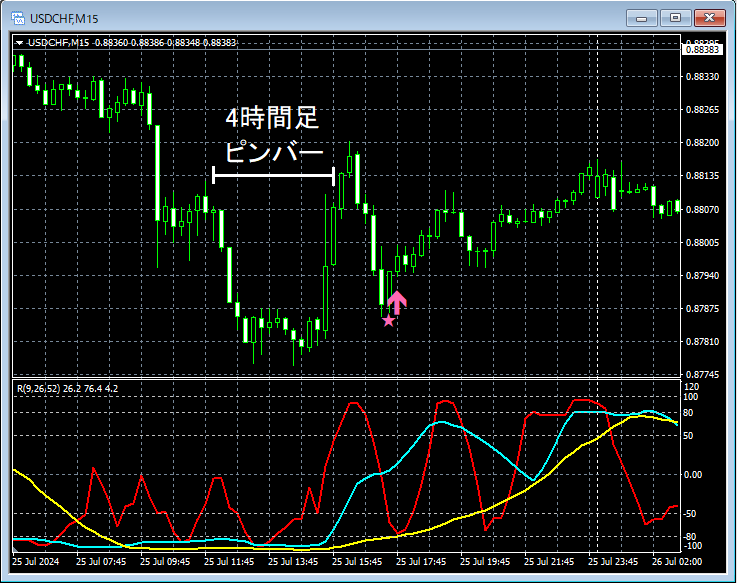
Moreover, on the 15-minute chart above, the timing is earlier than on the 1-hour chart,mBDSR (filter: RCI26 and RCI52) pullback buy signallights up.
From this example,a trading method focusing on Pins Bar (long lower shadow)andthe compatibility with mBDSR signalscan be seen to be highly aligned.
Indicator that shines in combination with RCI: 【BODSOR・mBDSR】
Methods and Case Studies (PDF) ★GogoJungle AWARD2020 Winner★
https://www.gogojungle.co.jp/tools/indicators/11836
The PDF files include 301 items (over 1,000 pages in total, over 350,000 words in total).
Many of them are composed as follows:A description of linking multiple lower timeframes logically with the RCI three-line setup to sequentially examine the状況 of multiple lower timeframes, ultimately waiting for the timing of pullbacks or reversals on the lower timeframes (i.e., mBDSR signals).
Also,many are focused on identifying points where multiple entry premises coincide.
The explanation usesover 1,000 charts.

Methods and Case Studies (PDF) ★GogoJungle AWARD2020 Winner★
https://www.gogojungle.co.jp/tools/indicators/11836
The above product includes 301 PDFs. For a list of the titles of those PDFs, please see the article below.
Regarding the 301 PDF files included with 【BODSOR・mBDSR】
https://www.gogojungle.co.jp/finance/navi/articles/34271
USD/CHF 4-hour chart
If you look around the area circled in white on the 4-hour chart above, it suggests an uptrendPin Bar (long lower shadow)appears. It may not be surprising to consider buying on dips on lower timeframes.
USD/CHF 1-hour chart
On the higher 1-hour chart,Pin Bar (long lower shadow)appearing is followed by an ascent,mBDSR (filter: RCI26 and RCI52) pullback buy signallights up and the price rises firmly.
USD/CHF 15-minute chart
Moreover, on the 15-minute chart above, the timing is earlier than on the 1-hour chart,mBDSR (filter: RCI26 and RCI52) pullback buy signallights up.
From this example,a trading method focusing on Pins Bar (long lower shadow)andthe compatibility with mBDSR signalscan be seen to be highly aligned.
Indicator that shines in combination with RCI: 【BODSOR・mBDSR】
Methods and Case Studies (PDF) ★GogoJungle AWARD2020 Winner★
https://www.gogojungle.co.jp/tools/indicators/11836
The PDF files include 301 items (over 1,000 pages in total, over 350,000 words in total).
Many of them are composed as follows:A description of linking multiple lower timeframes logically with the RCI three-line setup to sequentially examine the状況 of multiple lower timeframes, ultimately waiting for the timing of pullbacks or reversals on the lower timeframes (i.e., mBDSR signals).
Also,many are focused on identifying points where multiple entry premises coincide.
The explanation usesover 1,000 charts.
× ![]()


