

Pin bar on higher time frame, counter-trend line, and mBDSR (RCI with 2 filters) dip-buy signal
0
An indicator that captures "tops/bottoms and reversals" in combination with RCI【mBDSR】
Methods, case studies (PDF) ★GogoJungle AWARD 2020 winner★
https://www.gogojungle.co.jp/tools/indicators/11836
The above products include 301 PDFs. For a list of those PDFs’ titles and related details, please see the article below.
About the 301 PDF files accompanying 【BODSOR・mBDSR】
https://www.gogojungle.co.jp/finance/navi/articles/34271
EUR/JPY 1-hour chart
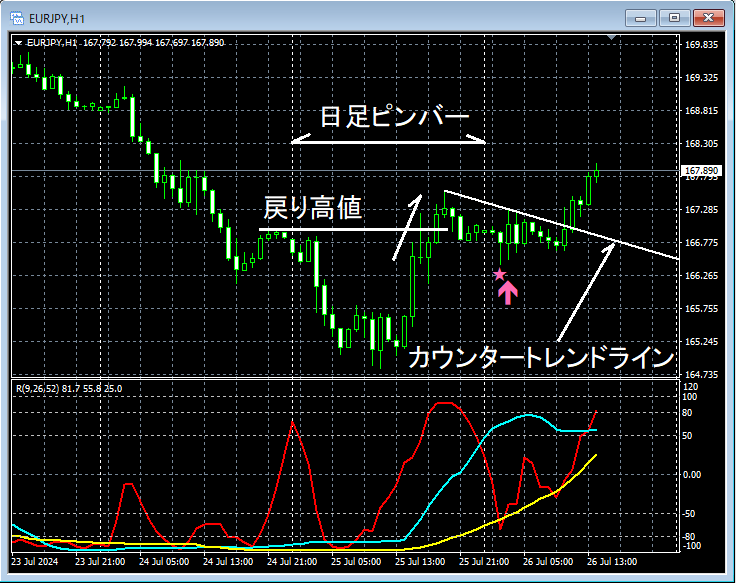
Although higher-timeframe charts are omitted, the daily chart suggests an upward trendPin bar (long lower shadow)appears.Daily pin barhas appeared, anda break above the return highmay present a good buying opportunity on pullbacks.
As you monitor the chart progression,mBDSR (RCI two-line filter) buy-the-dip signallights up and the price continues to rise.
The 1-hour pullback buy signal activates and the price rises, but here,counter-trend linebreakout is expected to be entered after, so on the lower time frame (5-minute chart)counter-trend linemovement around the breakout will be examined in detail.
EUR/JPY 5-minute chart
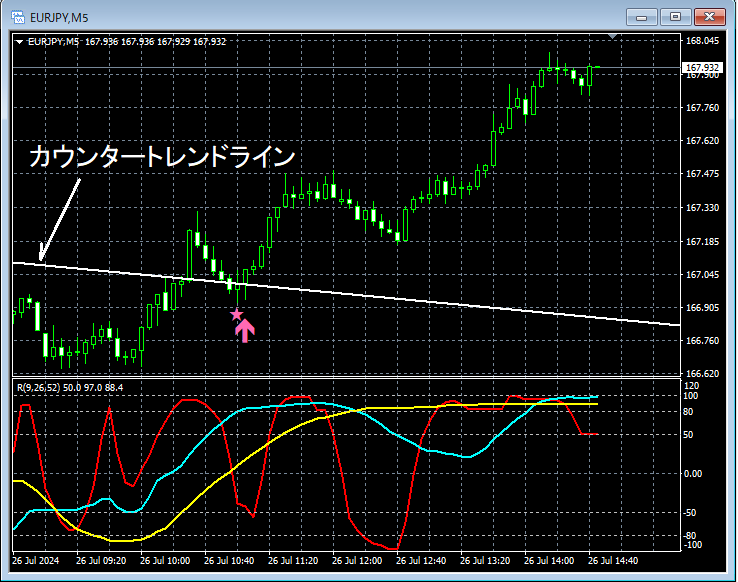
On the 5-minute chart above,counter-trend linebreaking to the upside showsmBDSR (RCI two-line filter pullback buy signalhas lit up and the price is rising steadily.
From this example,a trading approach focusing on pin bars, swing highs (Dow Theory), and counter-trend linesandthe signals of mBDSRshow a strong synergy.
The indicator【BODSOR・mBDSR】that excels when combined with RCI
Methods, case studies (PDF) ★GogoJungle AWARD 2020 winner★
https://www.gogojungle.co.jp/tools/indicators/11836
The PDF files number 301 (over 1,000 pages in total, over 350,000 words).
Many of them aredocuments detailing a method that uses three RCI lines to logically link higher and lower timeframes, sequentially analyzing multiple lower-timeframe conditions, and ultimately waiting for pullback buying or pullback selling timings (i.e., mBDSR signals) on the lower timeframesin a compiled form.
Additionally,many emphasize identifying points where multiple entry reasons coincideas a focus.
Explanation includesover 1,000 chartsused.

Methods, case studies (PDF) ★GogoJungle AWARD 2020 winner★
https://www.gogojungle.co.jp/tools/indicators/11836
The above products include 301 PDFs. For a list of those PDFs’ titles and related details, please see the article below.
About the 301 PDF files accompanying 【BODSOR・mBDSR】
https://www.gogojungle.co.jp/finance/navi/articles/34271
EUR/JPY 1-hour chart
Although higher-timeframe charts are omitted, the daily chart suggests an upward trendPin bar (long lower shadow)appears.Daily pin barhas appeared, anda break above the return highmay present a good buying opportunity on pullbacks.
As you monitor the chart progression,mBDSR (RCI two-line filter) buy-the-dip signallights up and the price continues to rise.
The 1-hour pullback buy signal activates and the price rises, but here,counter-trend linebreakout is expected to be entered after, so on the lower time frame (5-minute chart)counter-trend linemovement around the breakout will be examined in detail.
EUR/JPY 5-minute chart
On the 5-minute chart above,counter-trend linebreaking to the upside showsmBDSR (RCI two-line filter pullback buy signalhas lit up and the price is rising steadily.
From this example,a trading approach focusing on pin bars, swing highs (Dow Theory), and counter-trend linesandthe signals of mBDSRshow a strong synergy.
The indicator【BODSOR・mBDSR】that excels when combined with RCI
Methods, case studies (PDF) ★GogoJungle AWARD 2020 winner★
https://www.gogojungle.co.jp/tools/indicators/11836
The PDF files number 301 (over 1,000 pages in total, over 350,000 words).
Many of them aredocuments detailing a method that uses three RCI lines to logically link higher and lower timeframes, sequentially analyzing multiple lower-timeframe conditions, and ultimately waiting for pullback buying or pullback selling timings (i.e., mBDSR signals) on the lower timeframesin a compiled form.
Additionally,many emphasize identifying points where multiple entry reasons coincideas a focus.
Explanation includesover 1,000 chartsused.
× ![]()


