

[Yesterday's AUDJPY] Prominent high price and long lower wick candlestick with mbDSR (RCI two-line filter) pullback buying signal from the chart of yesterday (July 26, 2024)
0
Indicator that captures “top-bottom and reversal” in combination with RCI【mBDSR】
Methods and case studies (PDF) ★GogoJungle AWARD2020 winner★
https://www.gogojungle.co.jp/tools/indicators/11836
The above products include 301 PDFs. For a list of the PDF titles, please see the article below.
About the 301 PDF files included with 【BODSOR・mBDSR】
https://www.gogojungle.co.jp/finance/navi/articles/34271
AUD/JPY Weekly

If you look at the area encircled in white on the weekly chart above,a noticeable high pricemay be near a potential rebound area where it has dropped to.
AUD/JPY Daily
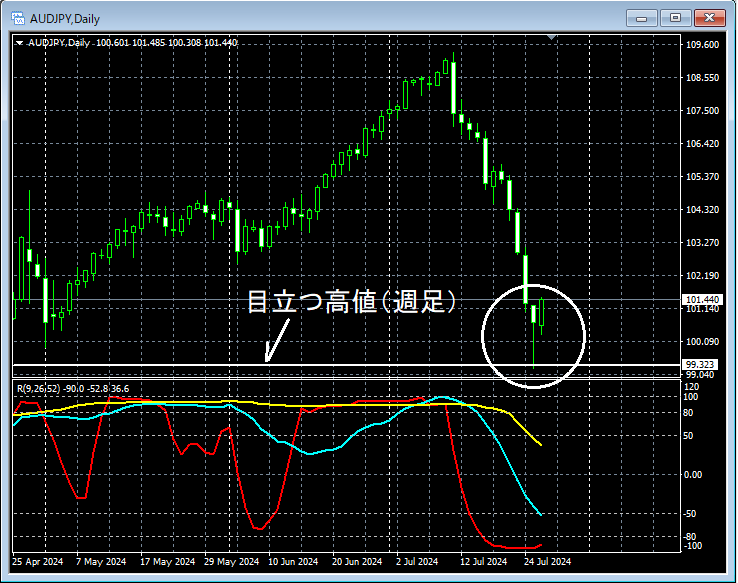
When you look at the area encircled in white on the daily chart above,a conspicuous high on the weekly levelhas dropped to and then indicates a risea long lower shadow candlestickappears. It may not be unusual to consider buying on the pullback on lower timeframes.
AUD/JPY 1-hour

In the 1-hour chart above,a long lower shadow candlestickin the daily chart is followed by a decline after a risemBDSR (two RCI lines filter) pullback buy signallights up, and subsequently the price rises firmly.
From this example,a trading method focusing on noticeable highs and candlesticks with long lower shadowsandthe signals of mBDSRshow strong compatibility.
Indicator that shows power when combined with RCI【BODSOR・mBDSR】
Methods and case studies (PDF) ★GogoJungle AWARD2020 winner★
https://www.gogojungle.co.jp/tools/indicators/11836
The PDF files include 301 files (over 1,000 pages, over 350,000 characters in total).
Most of them are designed as follows:They logically link higher and lower timeframes using three RCI lines, sequentially examining the conditions of multiple lower timeframes, and ultimately waiting for pullback buys or pullback sells on the lower timeframes (i.e., mBDSR signals).This is what they are about.
Additionally,many focus on capturing points where multiple entry reasons overlapas well.
The explanations usemore than 1,000 chartsin total.

Methods and case studies (PDF) ★GogoJungle AWARD2020 winner★
https://www.gogojungle.co.jp/tools/indicators/11836
The above products include 301 PDFs. For a list of the PDF titles, please see the article below.
About the 301 PDF files included with 【BODSOR・mBDSR】
https://www.gogojungle.co.jp/finance/navi/articles/34271
AUD/JPY Weekly
If you look at the area encircled in white on the weekly chart above,a noticeable high pricemay be near a potential rebound area where it has dropped to.
AUD/JPY Daily
When you look at the area encircled in white on the daily chart above,a conspicuous high on the weekly levelhas dropped to and then indicates a risea long lower shadow candlestickappears. It may not be unusual to consider buying on the pullback on lower timeframes.
AUD/JPY 1-hour
In the 1-hour chart above,a long lower shadow candlestickin the daily chart is followed by a decline after a risemBDSR (two RCI lines filter) pullback buy signallights up, and subsequently the price rises firmly.
From this example,a trading method focusing on noticeable highs and candlesticks with long lower shadowsandthe signals of mBDSRshow strong compatibility.
Indicator that shows power when combined with RCI【BODSOR・mBDSR】
Methods and case studies (PDF) ★GogoJungle AWARD2020 winner★
https://www.gogojungle.co.jp/tools/indicators/11836
The PDF files include 301 files (over 1,000 pages, over 350,000 characters in total).
Most of them are designed as follows:They logically link higher and lower timeframes using three RCI lines, sequentially examining the conditions of multiple lower timeframes, and ultimately waiting for pullback buys or pullback sells on the lower timeframes (i.e., mBDSR signals).This is what they are about.
Additionally,many focus on capturing points where multiple entry reasons overlapas well.
The explanations usemore than 1,000 chartsin total.
× ![]()


