

Pin Bar on the Upper Foot (candlestick with a long lower wick) and mBDSR (RCI two-filter) bullish signal
Indicator that captures “tops and bottoms and reversals” in combination with RCI【mBDSR】
Methods and Case Studies (PDF) ★GogoJungle AWARD2020 winner★
https://www.gogojungle.co.jp/tools/indicators/11836
The above products include 301 PDFs. For a list of titles of those PDFs, please see the article below.
About the 301 PDF files included with 【BODSOR・mBDSR】
https://www.gogojungle.co.jp/finance/navi/articles/34271
AUDUSD 4-hour chart
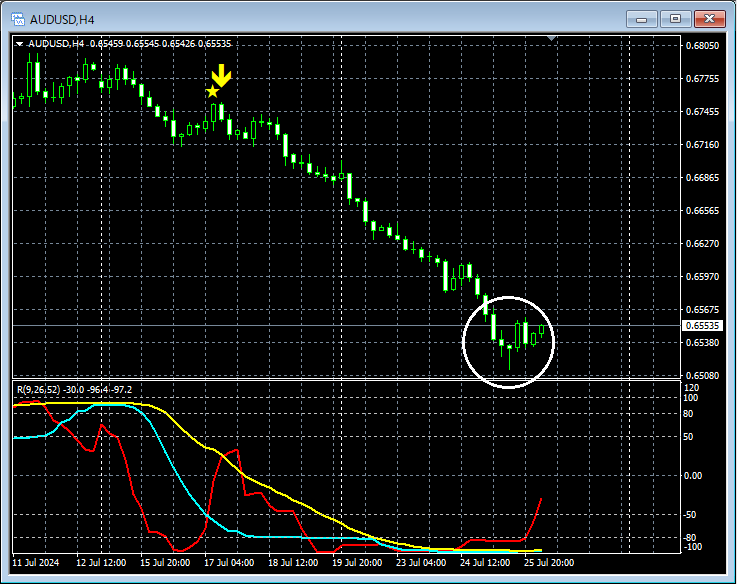
Looking at the area circled in white on the 4-hour chart above, it suggests an upward movePin Bar (long lower wick)appears. It might not be strange to consider a pullback buy on lower timeframes.
AUDUSD 1-hour chart
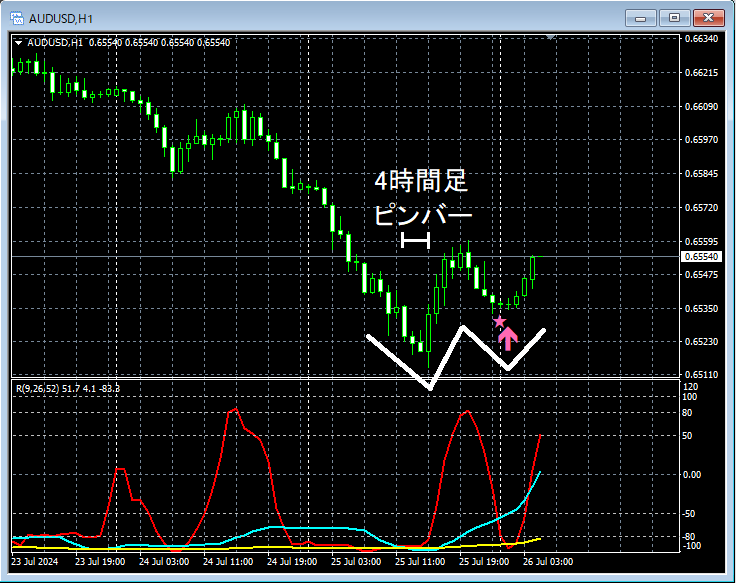
On the upper 1-hour chart, in the context of the 4-hour chartPin Bar (long lower wick)appearance followed by a pullback after the risemBDSR (Filter: RCI26 and RCI52) pullback buy signalis lit. If the rise continues, this signaldouble bottomwill be capturing the timing of the start of the rise at the right-side valley.
AUDUSD 1-hour chart continuation
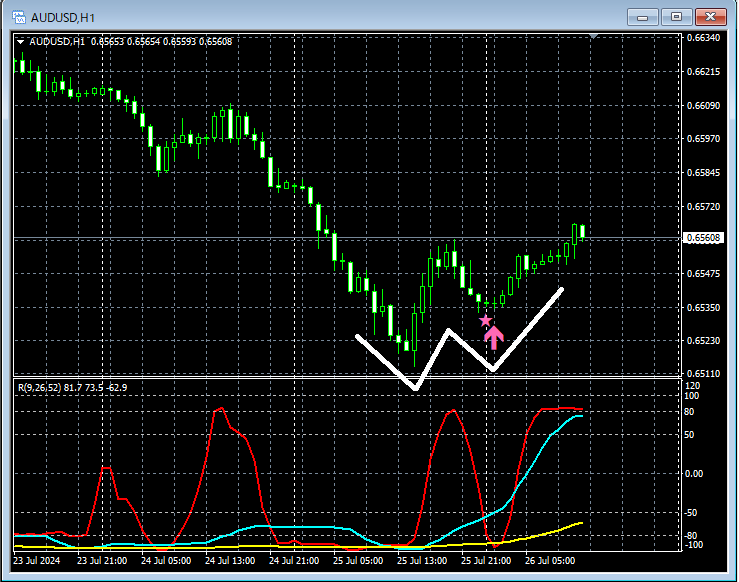
Subsequently, the 1-hour chart rises a bitdouble bottomand forms.
From this example,a trading method focused on pin bars and double bottomsandthe signals of mBDSRshow strong compatibility.
The indicator that excels in combination with RCI【BODSOR・mBDSR】
Methods and Case Studies (PDF) ★GogoJungle AWARD2020 winner★
https://www.gogojungle.co.jp/tools/indicators/11836
The PDF file includes 301 items (over 1,000 pages, over 350,000 words in total).
Many of them are aboutexamining the status of multiple lower timeframes by logically linking the upper and lower timeframes using three RCI lines, ultimately detailing how to wait for pullbacks or selling rallies on the lower timeframes (i.e., mBDSR signals).
Additionally,many focus on identifying points where multiple entry reasons coincide.
The explanation usesover 1,000 charts.

Methods and Case Studies (PDF) ★GogoJungle AWARD2020 winner★
https://www.gogojungle.co.jp/tools/indicators/11836
The above products include 301 PDFs. For a list of titles of those PDFs, please see the article below.
About the 301 PDF files included with 【BODSOR・mBDSR】
https://www.gogojungle.co.jp/finance/navi/articles/34271
AUDUSD 4-hour chart
Looking at the area circled in white on the 4-hour chart above, it suggests an upward movePin Bar (long lower wick)appears. It might not be strange to consider a pullback buy on lower timeframes.
AUDUSD 1-hour chart
On the upper 1-hour chart, in the context of the 4-hour chartPin Bar (long lower wick)appearance followed by a pullback after the risemBDSR (Filter: RCI26 and RCI52) pullback buy signalis lit. If the rise continues, this signaldouble bottomwill be capturing the timing of the start of the rise at the right-side valley.
AUDUSD 1-hour chart continuation
Subsequently, the 1-hour chart rises a bitdouble bottomand forms.
From this example,a trading method focused on pin bars and double bottomsandthe signals of mBDSRshow strong compatibility.
The indicator that excels in combination with RCI【BODSOR・mBDSR】
Methods and Case Studies (PDF) ★GogoJungle AWARD2020 winner★
https://www.gogojungle.co.jp/tools/indicators/11836
The PDF file includes 301 items (over 1,000 pages, over 350,000 words in total).
Many of them are aboutexamining the status of multiple lower timeframes by logically linking the upper and lower timeframes using three RCI lines, ultimately detailing how to wait for pullbacks or selling rallies on the lower timeframes (i.e., mBDSR signals).
Additionally,many focus on identifying points where multiple entry reasons coincide.
The explanation usesover 1,000 charts.
× ![]()


