

[Today’s USD/JPY Strategy] The important moving average, daily pin bar, and mBDSR (RCI two-filter) dip-buy signal from the USD/JPY chart on July 26, 2024
0
An indicator that captures “top and bottom reversal” in combination with RCI【mBDSR】
and methodology / case studies (PDF) ★GogoJungle AWARD2020 winner★
https://www.gogojungle.co.jp/tools/indicators/11836
The above products include 301 PDFs. For a list of the PDF titles, please see the article below.
About the 301 PDF files included with 【BODSOR・mBDSR】
https://www.gogojungle.co.jp/finance/navi/articles/34271
Dollar/Yen Daily Chart
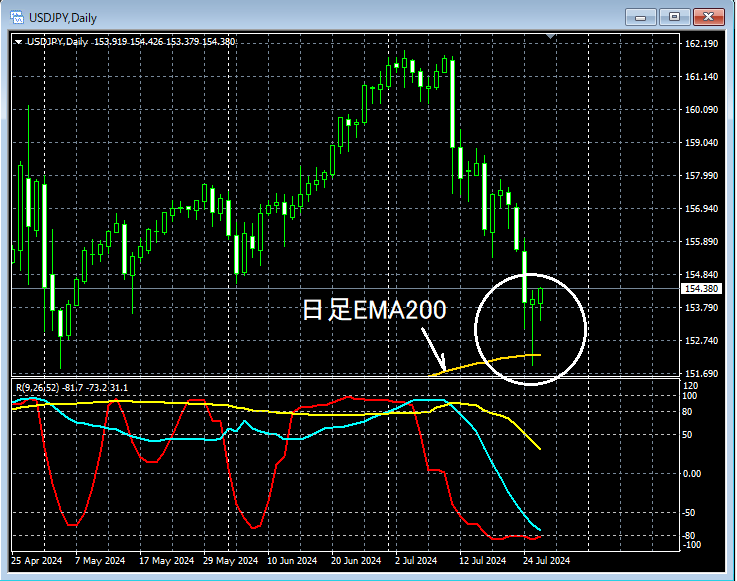
Looking at the area circled in white on the higher daily chart, yesterday we paid attention to an important levelDaily EMA200It fell toward the vicinity and then rose, suggesting a potential risePin Bar (long lower shadow candle)appears. Today may be a scenario where buying on dips is not unusual.
Dollar/Yen 1-Hour Chart
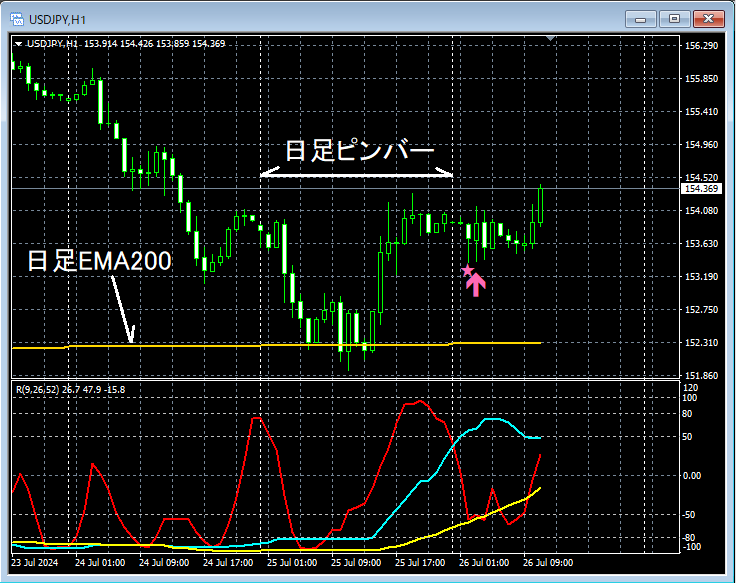
On the above 1-hour chart, the Pin Bar (long lower shadow candle) on the daily chartPin Barfollowed by a decline after the risemBDSR (Filter: RCI26 and RCI52) dip-buy signalis lit. It has risen a bit since then.
From this example,a trading method focused on pin barsandthe signals of mBDSRshow high compatibility.
Indicator that excels in combination with RCI: 【BODSOR・mBDSR】
and methodology / case studies (PDF) ★GogoJungle AWARD2020 winner★
https://www.gogojungle.co.jp/tools/indicators/11836
The PDFs include 301 files (over 1,000 pages, over 350,000 characters in total).
Most of them are about the form of logically linking multiple higher-timeframe and lower-timeframe charts using three RCI lines to sequentially examine the conditions of multiple lower timeframes, ultimately waiting for dip-buy or rally-sell timing (i.e., mBDSR signals) on the lower timeframe
Additionally,many emphasize capturing points where multiple entry reasons overlap.
The explanation usesover 1,000 charts.

and methodology / case studies (PDF) ★GogoJungle AWARD2020 winner★
https://www.gogojungle.co.jp/tools/indicators/11836
The above products include 301 PDFs. For a list of the PDF titles, please see the article below.
About the 301 PDF files included with 【BODSOR・mBDSR】
https://www.gogojungle.co.jp/finance/navi/articles/34271
Dollar/Yen Daily Chart
Looking at the area circled in white on the higher daily chart, yesterday we paid attention to an important levelDaily EMA200It fell toward the vicinity and then rose, suggesting a potential risePin Bar (long lower shadow candle)appears. Today may be a scenario where buying on dips is not unusual.
Dollar/Yen 1-Hour Chart
On the above 1-hour chart, the Pin Bar (long lower shadow candle) on the daily chartPin Barfollowed by a decline after the risemBDSR (Filter: RCI26 and RCI52) dip-buy signalis lit. It has risen a bit since then.
From this example,a trading method focused on pin barsandthe signals of mBDSRshow high compatibility.
Indicator that excels in combination with RCI: 【BODSOR・mBDSR】
and methodology / case studies (PDF) ★GogoJungle AWARD2020 winner★
https://www.gogojungle.co.jp/tools/indicators/11836
The PDFs include 301 files (over 1,000 pages, over 350,000 characters in total).
Most of them are about the form of logically linking multiple higher-timeframe and lower-timeframe charts using three RCI lines to sequentially examine the conditions of multiple lower timeframes, ultimately waiting for dip-buy or rally-sell timing (i.e., mBDSR signals) on the lower timeframe
Additionally,many emphasize capturing points where multiple entry reasons overlap.
The explanation usesover 1,000 charts.
× ![]()


