

Important moving average line, pin bar, and mBDSR (RCI double-filter) pullback buy sign
0
Indicator 【mBDSR】 that captures “tops/bottoms and reversals” in combination with RCI
Methods and Case Studies (PDF) ★GogoJungle AWARD2020 Winner★
https://www.gogojungle.co.jp/tools/indicators/11836
The above products include 301 PDFs. For a list of those PDF titles and related details, please see the article below.
Regarding the 301 PDF files included with 【BODSOR・mBDSR】
https://www.gogojungle.co.jp/finance/navi/articles/34271
Pound Swiss GBPCHF 4-hour chart
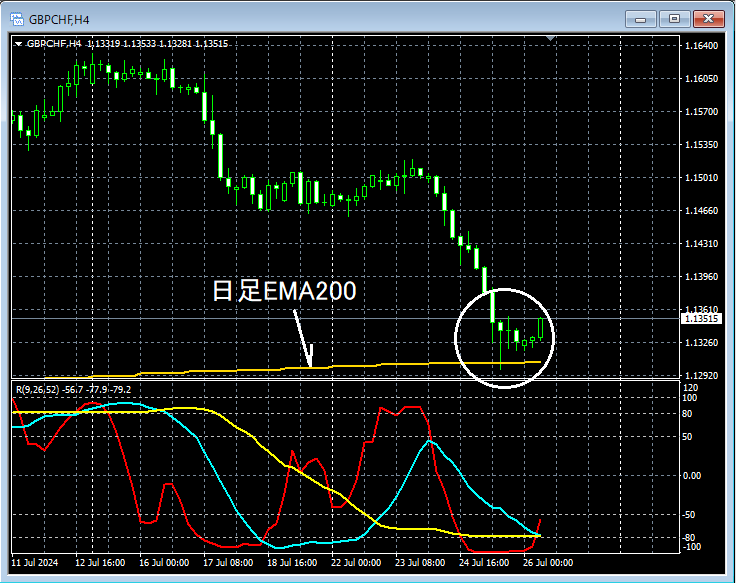
Looking at the area circled in white on the 4-hour chart above, it is being watched closelyby the vicinity of the Daily EMA200as it declines toward the vicinity, it signals a potential risePin Bar (candlestick with a long lower wick)appears. It may not be unusual to consider a buying opportunity on a pullback in a lower time frame.
Pound Swiss GBPCHF 1-hour chart
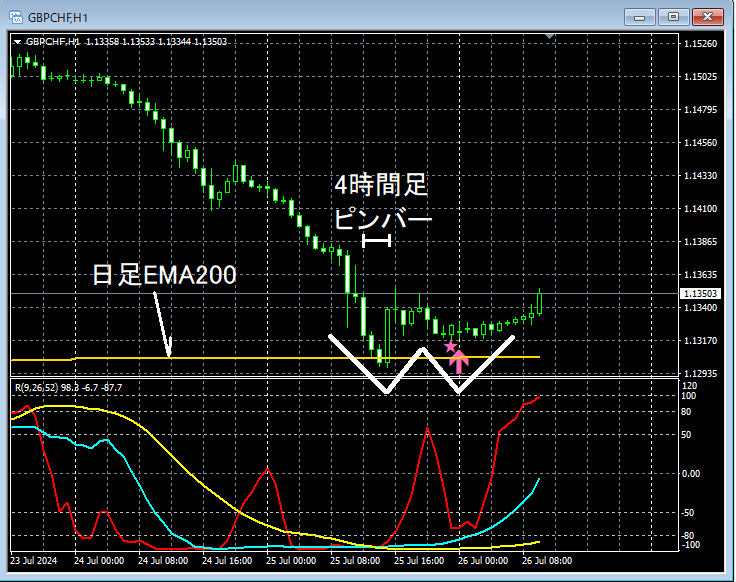
On the 1-hour chart above, the rise following the appearance of thePin Bar (candlestick with a long lower wick)in the 4-hour chart is followed by a pullback,mBDSR (Filter: RCI26 and RCI52) pullback buy signalis lit. If the price continues to rise, this signal would beformed near the Daily EMA200and would capture the timing of a rise from the right side of adouble bottomformed near that area.
Pound Swiss GBPCHF 1-hour chart continuation

Subsequently, on the 1-hour chart,double bottomis formed and the price rises firmly..
From this example,a trading approach focusing on pin bars and double bottomsandthe signals of mBDSRshow a strong compatibility.
Also in this example,placing the left-side valley of the double bottom slightly below the nearest lowallows for a good risk-reward trade.
Indicator 【BODSOR・mBDSR】 that shines in combination with RCI
Methods and Case Studies (PDF) ★GogoJungle AWARD2020 Winner★
https://www.gogojungle.co.jp/tools/indicators/11836
The PDF files include 301 documents (over 1,000 pages, over 350,000 characters in total).
Many of them show a method that links the higher and lower timeframes logically using the RCI three-line indicator, sequentially examining the conditions of multiple lower timeframes, and ultimately waiting for pullback buys on the lower timeframes or pullback sells (i.e., mBDSR signals).In addition,
there are many focusing on identifying points where multiple entry reasons overlapas well.
The explanations usemore than 1,000 chartsin total.

Methods and Case Studies (PDF) ★GogoJungle AWARD2020 Winner★
https://www.gogojungle.co.jp/tools/indicators/11836
The above products include 301 PDFs. For a list of those PDF titles and related details, please see the article below.
Regarding the 301 PDF files included with 【BODSOR・mBDSR】
https://www.gogojungle.co.jp/finance/navi/articles/34271
Pound Swiss GBPCHF 4-hour chart
Looking at the area circled in white on the 4-hour chart above, it is being watched closelyby the vicinity of the Daily EMA200as it declines toward the vicinity, it signals a potential risePin Bar (candlestick with a long lower wick)appears. It may not be unusual to consider a buying opportunity on a pullback in a lower time frame.
Pound Swiss GBPCHF 1-hour chart
On the 1-hour chart above, the rise following the appearance of thePin Bar (candlestick with a long lower wick)in the 4-hour chart is followed by a pullback,mBDSR (Filter: RCI26 and RCI52) pullback buy signalis lit. If the price continues to rise, this signal would beformed near the Daily EMA200and would capture the timing of a rise from the right side of adouble bottomformed near that area.
Pound Swiss GBPCHF 1-hour chart continuation
Subsequently, on the 1-hour chart,double bottomis formed and the price rises firmly..
From this example,a trading approach focusing on pin bars and double bottomsandthe signals of mBDSRshow a strong compatibility.
Also in this example,placing the left-side valley of the double bottom slightly below the nearest lowallows for a good risk-reward trade.
Indicator 【BODSOR・mBDSR】 that shines in combination with RCI
Methods and Case Studies (PDF) ★GogoJungle AWARD2020 Winner★
https://www.gogojungle.co.jp/tools/indicators/11836
The PDF files include 301 documents (over 1,000 pages, over 350,000 characters in total).
Many of them show a method that links the higher and lower timeframes logically using the RCI three-line indicator, sequentially examining the conditions of multiple lower timeframes, and ultimately waiting for pullback buys on the lower timeframes or pullback sells (i.e., mBDSR signals).In addition,
there are many focusing on identifying points where multiple entry reasons overlapas well.
The explanations usemore than 1,000 chartsin total.
× ![]()


