

[Chart Research] Neckline and Resistance/Support Turnaround and mBDSR (RCI 2-line Filter) Buy Signal
0
Indicator 【mBDSR】 that captures “tops/bottoms and reversals” in combination with RCI
Methods, case studies (PDF) ★GogoJungle AWARD2020 Recipient★
https://www.gogojungle.co.jp/tools/indicators/11836
The above product includes 301 PDFs. For a list of their PDF titles, please see the article below.
About the 301 PDF files included with 【BODSOR・mBDSR】
https://www.gogojungle.co.jp/finance/navi/articles/34271
Bitcoin / USD BTCUSD 30-minute chart
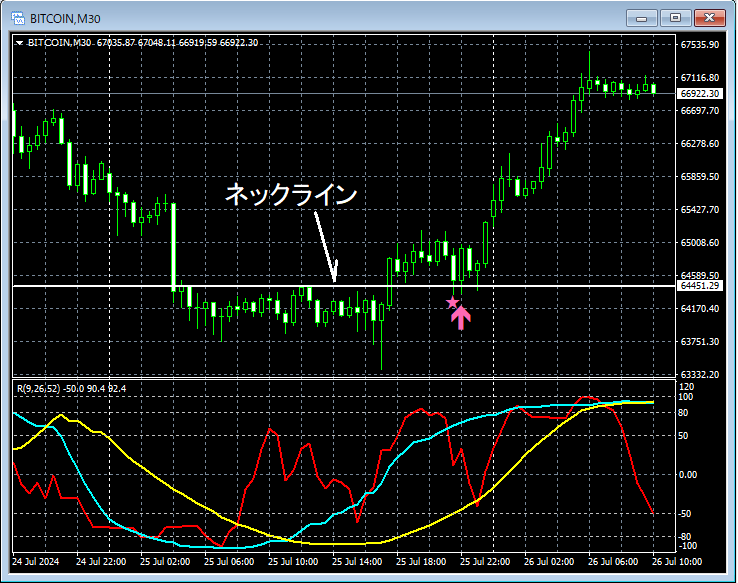
In the 30-minute chart above,Necklinehas fallen near themBDSR (two RCI lines) pullback buy signallighting up, and price has subsequently been rising smoothly (the so-calledsupport-turned-resistance to supportmovement).
From this example,a trading method focusing on the neckline and support/resistance turnsandthe mBDSR pullback buy signalshow strong compatibility.
Indicator 【BODSOR・mBDSR】 that exhibits power in combination with RCI
Methods, case studies (PDF) ★GogoJungle AWARD2020 Recipient★
https://www.gogojungle.co.jp/tools/indicators/11836
The PDFs include 301 files (over 1,000 pages, over 350,000 characters in total).
Many of them are about logically linking the higher and lower timeframes using three RCI lines, thoroughly examining multiple lower-timeframe conditions sequentially, and eventually detailing the timing for pullbacks buys or pullback sells on the lower timeframes (i.e., the mBDSR signals).It also summarizes the format where the final decision depends on waiting for the signals on the lower timeframes.
Additionally,many of them emphasize identifying points where multiple entry reasons converge.There are many explanations.
A total of more than 1,000 charts are used in the explanations.

Methods, case studies (PDF) ★GogoJungle AWARD2020 Recipient★
https://www.gogojungle.co.jp/tools/indicators/11836
The above product includes 301 PDFs. For a list of their PDF titles, please see the article below.
About the 301 PDF files included with 【BODSOR・mBDSR】
https://www.gogojungle.co.jp/finance/navi/articles/34271
Bitcoin / USD BTCUSD 30-minute chart
In the 30-minute chart above,Necklinehas fallen near themBDSR (two RCI lines) pullback buy signallighting up, and price has subsequently been rising smoothly (the so-calledsupport-turned-resistance to supportmovement).
From this example,a trading method focusing on the neckline and support/resistance turnsandthe mBDSR pullback buy signalshow strong compatibility.
Indicator 【BODSOR・mBDSR】 that exhibits power in combination with RCI
Methods, case studies (PDF) ★GogoJungle AWARD2020 Recipient★
https://www.gogojungle.co.jp/tools/indicators/11836
The PDFs include 301 files (over 1,000 pages, over 350,000 characters in total).
Many of them are about logically linking the higher and lower timeframes using three RCI lines, thoroughly examining multiple lower-timeframe conditions sequentially, and eventually detailing the timing for pullbacks buys or pullback sells on the lower timeframes (i.e., the mBDSR signals).It also summarizes the format where the final decision depends on waiting for the signals on the lower timeframes.
Additionally,many of them emphasize identifying points where multiple entry reasons converge.There are many explanations.
A total of more than 1,000 charts are used in the explanations.
× ![]()


