

Pullback signals at support prices and the moving averages considered important, with the mBDSR (RCI two-filter) buy signal
0
An Indicator that Captures Tops, Bottoms, and Reversals in Combination with RCI: mBDSR
Methods, Case Studies (PDF) ★GogoJungle AWARD2020 Winner★
https://www.gogojungle.co.jp/tools/indicators/11836
The above products include 301 PDF files. For a list of those PDF titles and related details, please see the article below.
About the 301 PDF files included with 【BODSOR・mBDSR】
https://www.gogojungle.co.jp/finance/navi/articles/34271
Bitcoin BTCUSD 4-hour chart
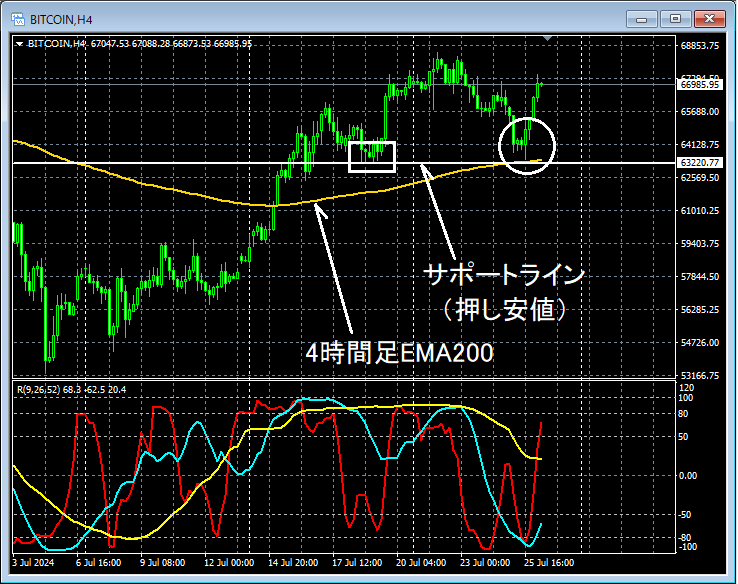
Details of the higher timeframe are omitted. On the 4-hour chart above, there is a strong rise followed by a slight pullback. Looking at the area circled in white, it is considered important4-hour EMA200andthe support line (pullback low)overlap around this area, which could present a scenario for buying the dip. Let us check for any signs of upward movement on the lower timeframes.
Bitcoin BTCUSD 30-minute chart
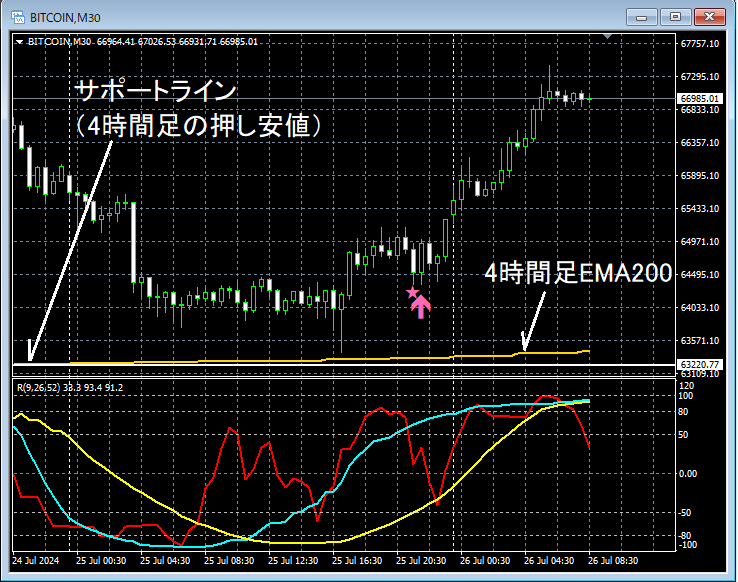
On the 30-minute chart above,4-hour EMA200andthe support line (pullback low)overlap, causing a rebound. Subsequently,mBDSR (RCI two-filter) buy-the-dip signallights up, and the price rises firmly.
From this example,a trading method focusing on reactions at moving averages and pullback lowsandthe signals of mBDSRappear to be highly synergistic.
Indicator that shines in combination with RCI: 【BODSOR・mBDSR】
Methods, Case Studies (PDF) ★GogoJungle AWARD2020 Winner★
https://www.gogojungle.co.jp/tools/indicators/11836
The PDF files amount to 301 in total (over 1,000 pages, over 350,000 characters).
Many of them are designed to logically link higher and lower timeframes using the RCI three-line setup, sequentially analyzing multiple lower-timeframe conditions, and ultimately capturing the timing for buying dips or selling retracements on the lower timeframes (i.e., mBDSR signals).It is also a collection that emphasizes identifying points where multiple entry reasons align.
In the explanations,
over 1,000 chartsare used.

Methods, Case Studies (PDF) ★GogoJungle AWARD2020 Winner★
https://www.gogojungle.co.jp/tools/indicators/11836
The above products include 301 PDF files. For a list of those PDF titles and related details, please see the article below.
About the 301 PDF files included with 【BODSOR・mBDSR】
https://www.gogojungle.co.jp/finance/navi/articles/34271
Bitcoin BTCUSD 4-hour chart
Details of the higher timeframe are omitted. On the 4-hour chart above, there is a strong rise followed by a slight pullback. Looking at the area circled in white, it is considered important4-hour EMA200andthe support line (pullback low)overlap around this area, which could present a scenario for buying the dip. Let us check for any signs of upward movement on the lower timeframes.
Bitcoin BTCUSD 30-minute chart
On the 30-minute chart above,4-hour EMA200andthe support line (pullback low)overlap, causing a rebound. Subsequently,mBDSR (RCI two-filter) buy-the-dip signallights up, and the price rises firmly.
From this example,a trading method focusing on reactions at moving averages and pullback lowsandthe signals of mBDSRappear to be highly synergistic.
Indicator that shines in combination with RCI: 【BODSOR・mBDSR】
Methods, Case Studies (PDF) ★GogoJungle AWARD2020 Winner★
https://www.gogojungle.co.jp/tools/indicators/11836
The PDF files amount to 301 in total (over 1,000 pages, over 350,000 characters).
Many of them are designed to logically link higher and lower timeframes using the RCI three-line setup, sequentially analyzing multiple lower-timeframe conditions, and ultimately capturing the timing for buying dips or selling retracements on the lower timeframes (i.e., mBDSR signals).It is also a collection that emphasizes identifying points where multiple entry reasons align.
In the explanations,
over 1,000 chartsare used.
× ![]()


