

Pin Bar on the higher timeframe and the mBDSR (RCI 2-filter) pullback buying signal
0
Indicator that captures “tops/bottoms and reversals” in combination with RCI【mBDSR】
Methods and Case Studies (PDF) ★GogoJungle AWARD2020 Winner★
https://www.gogojungle.co.jp/tools/indicators/11836
The above product includes 301 PDFs. For a list of the PDF titles, please refer to the article below.
About the 301 PDF files included with 【BODSOR・mBDSR】
https://www.gogojungle.co.jp/finance/navi/articles/34271
AUDNZD Daily
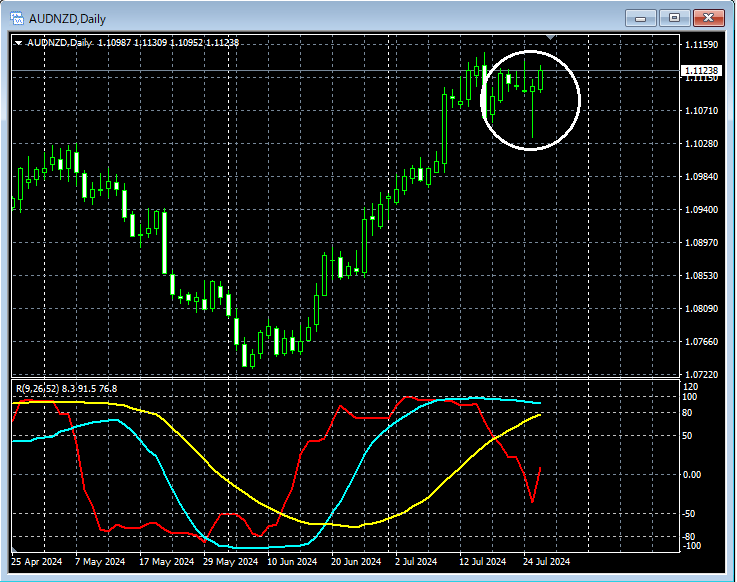
If you look at the area circled by the white circle on the above daily chart, it suggests an upward moveLong upper shadow (pin bar) candleis forming. It might be reasonable to consider that price could rise from here. We will look for a pullback buying opportunity on lower timeframes.
AUDNZD 5-minute chart
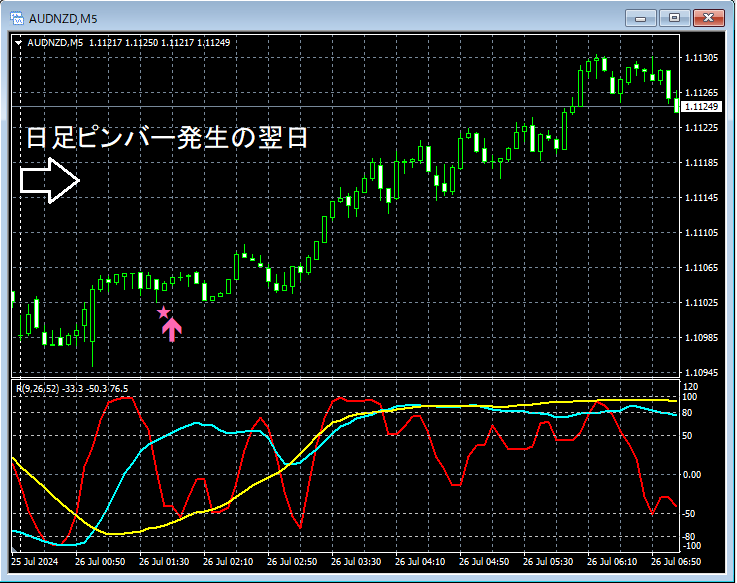
In the upper 5-minute chart, on the daily chartPin barappeared, and on the following daymBDSR (two RCI filter)pullback buy signal lights up, and subsequently price has risen smoothly.
From this example,a trading method focused on pin barsandthe signals of mBDSRshow a high degree of compatibility.
Furthermore, in this example,placing slightly below the recent lowenables a trade with favorable risk-reward.
Indicator that shines in combination with RCI【BODSOR・mBDSR】
Methods and Case Studies (PDF) ★GogoJungle AWARD2020 Winner★
https://www.gogojungle.co.jp/tools/indicators/11836
The PDF files include 301 files (over 1,000 pages, over 350,000 characters in total).
Many of them are focused on logically linking higher and lower timeframes using three RCI lines, systematically considering the status of multiple lower timeframes, and ultimately waiting for pullbacks or retracements on the lower timeframes (i.e., mBDSR signals).Additionally,
There are many such examples.
In the explanations,are used.

Methods and Case Studies (PDF) ★GogoJungle AWARD2020 Winner★
https://www.gogojungle.co.jp/tools/indicators/11836
The above product includes 301 PDFs. For a list of the PDF titles, please refer to the article below.
About the 301 PDF files included with 【BODSOR・mBDSR】
https://www.gogojungle.co.jp/finance/navi/articles/34271
AUDNZD Daily
If you look at the area circled by the white circle on the above daily chart, it suggests an upward moveLong upper shadow (pin bar) candleis forming. It might be reasonable to consider that price could rise from here. We will look for a pullback buying opportunity on lower timeframes.
AUDNZD 5-minute chart
In the upper 5-minute chart, on the daily chartPin barappeared, and on the following daymBDSR (two RCI filter)pullback buy signal lights up, and subsequently price has risen smoothly.
From this example,a trading method focused on pin barsandthe signals of mBDSRshow a high degree of compatibility.
Furthermore, in this example,placing slightly below the recent lowenables a trade with favorable risk-reward.
Indicator that shines in combination with RCI【BODSOR・mBDSR】
Methods and Case Studies (PDF) ★GogoJungle AWARD2020 Winner★
https://www.gogojungle.co.jp/tools/indicators/11836
The PDF files include 301 files (over 1,000 pages, over 350,000 characters in total).
Many of them are focused on logically linking higher and lower timeframes using three RCI lines, systematically considering the status of multiple lower timeframes, and ultimately waiting for pullbacks or retracements on the lower timeframes (i.e., mBDSR signals).Additionally,
There are many such examples.
In the explanations,are used.
× ![]()


