

The moving average lines that are regarded as important and the buy signal by the two-filter mBDSR (RCI2) pullback
0
Indicator that captures "tops and bottoms and reversals" in combination with RCI: 【mBDSR】
Methods and case studies (PDF) ★GogoJungle AWARD2020 winner★
https://www.gogojungle.co.jp/tools/indicators/11836
The above products include 301 PDFs. For the list of the PDFs titles, please refer to the article below.
About the 301 PDF files bundled with 【BODSOR・mBDSR】
https://www.gogojungle.co.jp/finance/navi/articles/34271
AUDNZD 4-hour chart
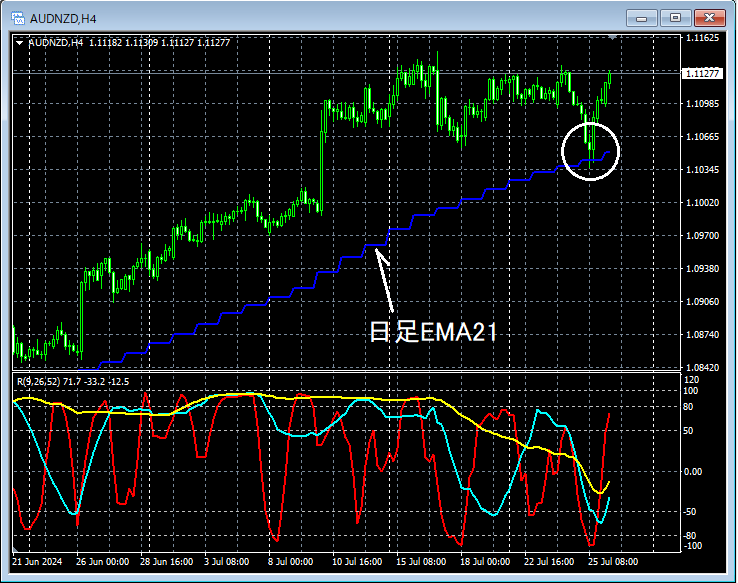
The status of the higher time frame is omitted. On the 4-hour chart above, there is a strong rise followed by a slight pullback. Looking at the area circled with a white circle, it is being considered importantDaily EMA21It has recently pulled back toward the vicinity, which may present a situation where a buying the dip could be reasonable. I will check for signs of a bullish move on the lower time frame.
AUDNZD 5-minute chart
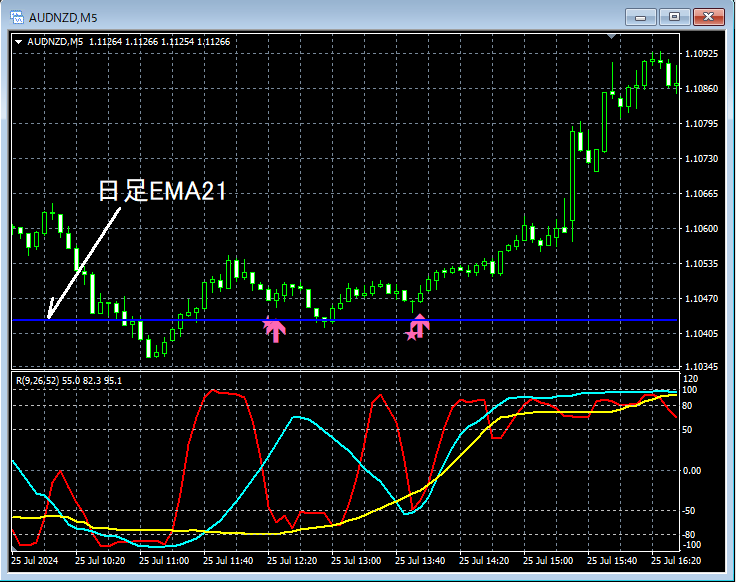
On the upper 5-minute chart,mBDSR (two RCI filters) dip-buy signallit up twice, and afterward, price rose sharply.
From this example,a trading method focusing on reversals at moving averagesandthe signals of mBDSRshow strong compatibility.
Additionally, in this example,placing slightly below the recent lowcould yield a favorable risk-reward trade.
Indicator that shines in combination with RCI: 【BODSOR・mBDSR】
Methods and case studies (PDF) ★GogoJungle AWARD2020 winner★
https://www.gogojungle.co.jp/tools/indicators/11836
The PDF files number 301 (over 1,000 pages, over 350,000 characters in total).
Many of them are designed as a comprehensive analysis of multiple lower time frames by logically linking higher and lower time frames using three RCI lines, ultimately waiting for a pullback buy or a rebound sell timing (i.e., mBDSR signals) on the lower time frame.
Also,there are many that emphasize identifying points where multiple entry reasons overlap..
The explanations usemore than 1,000 charts in total..

Methods and case studies (PDF) ★GogoJungle AWARD2020 winner★
https://www.gogojungle.co.jp/tools/indicators/11836
The above products include 301 PDFs. For the list of the PDFs titles, please refer to the article below.
About the 301 PDF files bundled with 【BODSOR・mBDSR】
https://www.gogojungle.co.jp/finance/navi/articles/34271
AUDNZD 4-hour chart
The status of the higher time frame is omitted. On the 4-hour chart above, there is a strong rise followed by a slight pullback. Looking at the area circled with a white circle, it is being considered importantDaily EMA21It has recently pulled back toward the vicinity, which may present a situation where a buying the dip could be reasonable. I will check for signs of a bullish move on the lower time frame.
AUDNZD 5-minute chart
On the upper 5-minute chart,mBDSR (two RCI filters) dip-buy signallit up twice, and afterward, price rose sharply.
From this example,a trading method focusing on reversals at moving averagesandthe signals of mBDSRshow strong compatibility.
Additionally, in this example,placing slightly below the recent lowcould yield a favorable risk-reward trade.
Indicator that shines in combination with RCI: 【BODSOR・mBDSR】
Methods and case studies (PDF) ★GogoJungle AWARD2020 winner★
https://www.gogojungle.co.jp/tools/indicators/11836
The PDF files number 301 (over 1,000 pages, over 350,000 characters in total).
Many of them are designed as a comprehensive analysis of multiple lower time frames by logically linking higher and lower time frames using three RCI lines, ultimately waiting for a pullback buy or a rebound sell timing (i.e., mBDSR signals) on the lower time frame.
Also,there are many that emphasize identifying points where multiple entry reasons overlap..
The explanations usemore than 1,000 charts in total..
× ![]()


