

[Today's Pound-Yen Strategy] Key moving averages, pin bar, head and shoulders, and mBDSR (RCI 2-line filter) selling signal from the Pound/Yen chart of July 26, 2024
Indicator that captures “tops and bottoms and reversals” in combination with RCI【mBDSR】
Methods and Case Studies (PDF) ★GogoJungle AWARD2020★
https://www.gogojungle.co.jp/tools/indicators/11836
The above products include 301 PDFs. For a list of the PDF titles and more, please see the article below.
About the 301 PDF files included with 【BODSOR・mBDSR】
https://www.gogojungle.co.jp/finance/navi/articles/34271
GBP/JPY 1-hour chart
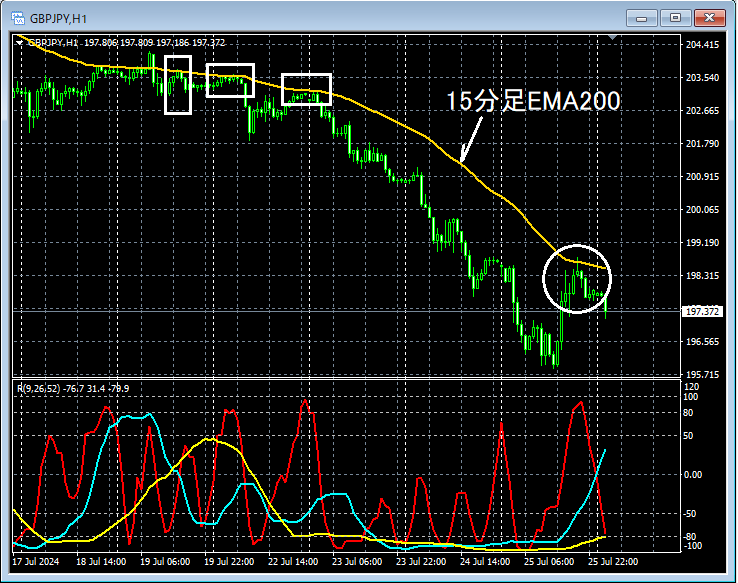
Looking at the area circled in white on the 1-hour chart above, it has historically functioned as resistance and is regarded as importantEMA200 on the 15-minute charthas risen toward the vicinity, suggesting a potential dropPin bar (long upper wick candle)appears. It might be reasonable to consider selling on rallies on lower timeframes.
GBP/JPY 5-minute chart
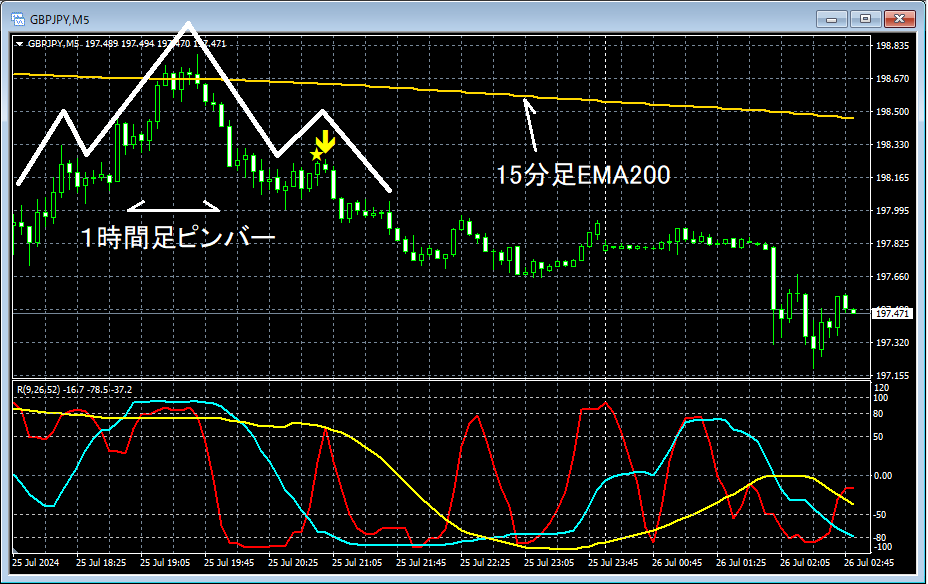
On the upper 5-minute chart,Pin bar (long upper wick candle)signals a subsequent rise after a declinemBDSR (Filter: RCI26 and RCI52) sell signallights up. This signalnear the EMA200 on the 15-minute chartformed as the middle peak,Head and shoulderstiming the start of the decline on the right shoulder.
From this example,the synergy between moving averages, pin bars, and head-and-shoulders trading approachesandsigns from mBDSRis evident.
Indicator that excels in combination with RCI【BODSOR・mBDSR】
Methods and Case Studies (PDF) ★GogoJungle AWARD2020★
https://www.gogojungle.co.jp/tools/indicators/11836
The PDF files include 301 items (over 1,000 pages, over 350,000 words in total).
Many of them explain how to logically link higher and lower timeframes using the 3-line RCI, to sequentially analyze multiple lower-timeframe conditions, and ultimately wait for the timing to buy on dips or sell on rallies (i.e., mBDSR signals).
Also,many focus on identifying points where multiple entry reasons overlap..
Explanation usesover 1,000 charts.

Methods and Case Studies (PDF) ★GogoJungle AWARD2020★
https://www.gogojungle.co.jp/tools/indicators/11836
The above products include 301 PDFs. For a list of the PDF titles and more, please see the article below.
About the 301 PDF files included with 【BODSOR・mBDSR】
https://www.gogojungle.co.jp/finance/navi/articles/34271
GBP/JPY 1-hour chart
Looking at the area circled in white on the 1-hour chart above, it has historically functioned as resistance and is regarded as importantEMA200 on the 15-minute charthas risen toward the vicinity, suggesting a potential dropPin bar (long upper wick candle)appears. It might be reasonable to consider selling on rallies on lower timeframes.
GBP/JPY 5-minute chart
On the upper 5-minute chart,Pin bar (long upper wick candle)signals a subsequent rise after a declinemBDSR (Filter: RCI26 and RCI52) sell signallights up. This signalnear the EMA200 on the 15-minute chartformed as the middle peak,Head and shoulderstiming the start of the decline on the right shoulder.
From this example,the synergy between moving averages, pin bars, and head-and-shoulders trading approachesandsigns from mBDSRis evident.
Indicator that excels in combination with RCI【BODSOR・mBDSR】
Methods and Case Studies (PDF) ★GogoJungle AWARD2020★
https://www.gogojungle.co.jp/tools/indicators/11836
The PDF files include 301 items (over 1,000 pages, over 350,000 words in total).
Many of them explain how to logically link higher and lower timeframes using the 3-line RCI, to sequentially analyze multiple lower-timeframe conditions, and ultimately wait for the timing to buy on dips or sell on rallies (i.e., mBDSR signals).
Also,many focus on identifying points where multiple entry reasons overlap..
Explanation usesover 1,000 charts.
× ![]()


