

【Today's USD/JPY Strategy】 The moving averages we pay attention to, the pin bar, and the mBDSR (RCI two-line filter) support-buy signal from the USD/JPY chart of July 25, 2024
Indicator that captures bottoming and reversal by combining with RCI: 【mBDSR】
Methods and Case Studies (PDF) ★GogoJungle AWARD 2020 Winner★
https://www.gogojungle.co.jp/tools/indicators/11836
The above product includes 301 PDFs. For a list of the titles of those PDFs and other details, please see the article below.
About the 301 PDF files included with 【BODSOR・mBDSR】
https://www.gogojungle.co.jp/finance/navi/articles/34271
USD/JPY 4-hour chart
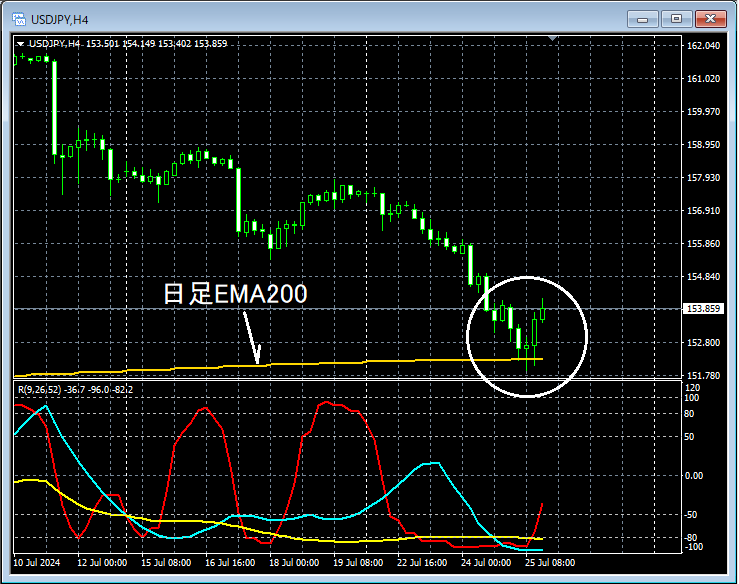
If you look at the area circled in white on the above 4-hour chart, you can see that it is paying attention tothe daily EMA200Nearby, indicating a potential risePin bar (long lower wick)appears. It might be a scene where buying on dips on a lower timeframe is not unusual.
USD/JPY 5-minute chart
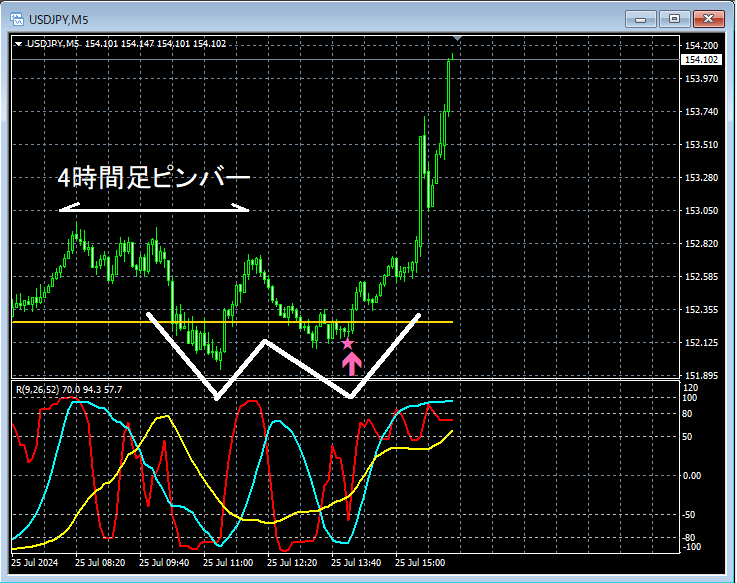
On the 5-minute chart above, thePin bar (long lower wick)is followed by a decline after an ascent in the 4-hour chartmBDSR (Filter: RCI26 and RCI52) dip-buy signallights up. This signal isformed near the daily EMA200as part of adouble bottomon the right side, capturing the optimal timing for a rise.
From this example,the trading approach focusing on pin bars and double bottomsandthe signals of mBDSRshow a strong compatibility.
Also in this example,placing the left-side valley of the double bottom slightly below the recent lowcan yield a favorable risk-reward trade.
The indicator that shines in combination with RCI: 【BODSOR・mBDSR】
Methods and Case Studies (PDF) ★GogoJungle AWARD2020 Winner★
https://www.gogojungle.co.jp/tools/indicators/11836
The PDF files amount to 301 in total (over 1,000 pages, over 350,000 characters).
Most of them are about how to logically link higher and lower timeframes using the 3-line RCI to examine multiple lower-timeframe scenarios one by one, and ultimately to wait for a dip-buy or a pullback-sell timing on the lower timeframe (i.e., the mBDSR signal).
Also,many of them focus on identifying points where multiple entry reasons overlap. Descriptions use
over 1,000 charts..

Methods and Case Studies (PDF) ★GogoJungle AWARD 2020 Winner★
https://www.gogojungle.co.jp/tools/indicators/11836
The above product includes 301 PDFs. For a list of the titles of those PDFs and other details, please see the article below.
About the 301 PDF files included with 【BODSOR・mBDSR】
https://www.gogojungle.co.jp/finance/navi/articles/34271
USD/JPY 4-hour chart
If you look at the area circled in white on the above 4-hour chart, you can see that it is paying attention tothe daily EMA200Nearby, indicating a potential risePin bar (long lower wick)appears. It might be a scene where buying on dips on a lower timeframe is not unusual.
USD/JPY 5-minute chart
On the 5-minute chart above, thePin bar (long lower wick)is followed by a decline after an ascent in the 4-hour chartmBDSR (Filter: RCI26 and RCI52) dip-buy signallights up. This signal isformed near the daily EMA200as part of adouble bottomon the right side, capturing the optimal timing for a rise.
From this example,the trading approach focusing on pin bars and double bottomsandthe signals of mBDSRshow a strong compatibility.
Also in this example,placing the left-side valley of the double bottom slightly below the recent lowcan yield a favorable risk-reward trade.
The indicator that shines in combination with RCI: 【BODSOR・mBDSR】
Methods and Case Studies (PDF) ★GogoJungle AWARD2020 Winner★
https://www.gogojungle.co.jp/tools/indicators/11836
The PDF files amount to 301 in total (over 1,000 pages, over 350,000 characters).
Most of them are about how to logically link higher and lower timeframes using the 3-line RCI to examine multiple lower-timeframe scenarios one by one, and ultimately to wait for a dip-buy or a pullback-sell timing on the lower timeframe (i.e., the mBDSR signal).
Also,many of them focus on identifying points where multiple entry reasons overlap. Descriptions use
over 1,000 charts..
× ![]()


