

Translation (preserving HTML, with decoded text): Inverse triple top and double bottom and mBDSR (RCI2 two-filter) buy signal
0
An indicator that captures the bottom and reversal in combination with RCI: mBDSR
Methods and case studies (PDF) ★GogoJungle AWARD2020 winner★
https://www.gogojungle.co.jp/tools/indicators/11836
The above products include 301 PDFs (methods, case studies, etc.). For the list of those PDF titles, please see the article below.
About the 301 PDF files included with 【BODSOR・mBDSR】
https://www.gogojungle.co.jp/finance/navi/articles/34271
AUDUSD 5-minute chart
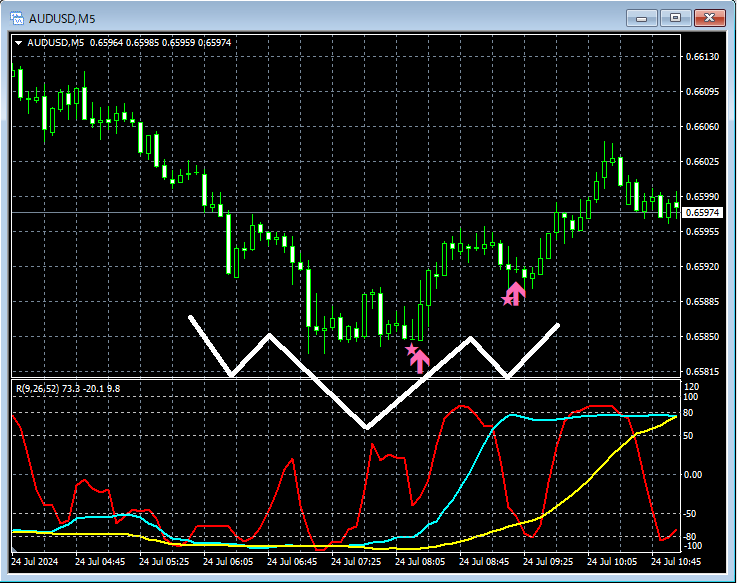
The status of the higher time frame is omitted. Here, on the upper 5-minute chart, regardingsignals of mBDSR (two RCI lines filter)we will examine them.
Looking at the chart above,the signal to buy on a pullback for the middle valley of the head-and-shoulders and the valley on the rightare illuminated.
The middle valley of the head-and-shouldersis, in finer detail,a double bottomcan be seen. In other words,the pullback-buy signal of mBDSR (two-RCI-filter) lighted up on the middle valley of the head-and-shoulderscan also be interpreted as lighting up on the right valley of the double bottom.
From this example,the trading approach that focuses on head-and-shoulders or double bottomsand the signals ofappear to be highly compatible.
Additionally, in the above example, especially for the first signal, placing the stop-loss a little below the left valley of the double bottom (the most recent low)can yield a favorable risk-reward trade.
Indicator that shines in combination with RCI: 【BODSOR・mBDSR】
Methods and case studies (PDF) ★GogoJungle AWARD2020 winner★
https://www.gogojungle.co.jp/tools/indicators/11836
The PDFs include 301 files (over 1,000 pages in total, over 350,000 words).
Many of them describe examples that logically link higher and lower timeframes using three RCI lines, sequentially examining the status of multiple lower timeframes, and ultimately waiting for pullbacks in the lower timeframes (i.e., signals of mBDSR) at timing for buying on dips or selling on rallies.
In addition,many emphasize identifying points where multiple entry reasons coincide..
The explanations usemore than 1,000 charts.

Methods and case studies (PDF) ★GogoJungle AWARD2020 winner★
https://www.gogojungle.co.jp/tools/indicators/11836
The above products include 301 PDFs (methods, case studies, etc.). For the list of those PDF titles, please see the article below.
About the 301 PDF files included with 【BODSOR・mBDSR】
https://www.gogojungle.co.jp/finance/navi/articles/34271
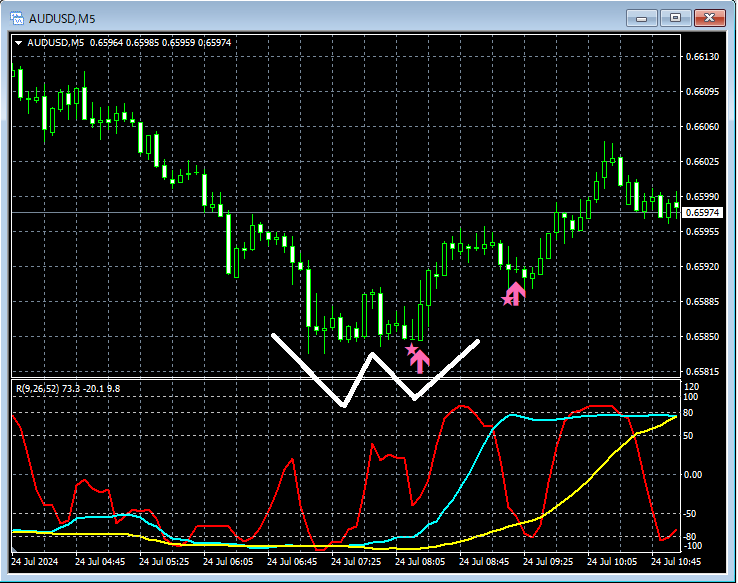
AUDUSD 5-minute chart
The status of the higher time frame is omitted. Here, on the upper 5-minute chart, regardingsignals of mBDSR (two RCI lines filter)we will examine them.
Looking at the chart above,the signal to buy on a pullback for the middle valley of the head-and-shoulders and the valley on the rightare illuminated.
The middle valley of the head-and-shouldersis, in finer detail,a double bottomcan be seen. In other words,the pullback-buy signal of mBDSR (two-RCI-filter) lighted up on the middle valley of the head-and-shoulderscan also be interpreted as lighting up on the right valley of the double bottom.
From this example,the trading approach that focuses on head-and-shoulders or double bottomsand the signals ofappear to be highly compatible.
Additionally, in the above example, especially for the first signal, placing the stop-loss a little below the left valley of the double bottom (the most recent low)can yield a favorable risk-reward trade.
Indicator that shines in combination with RCI: 【BODSOR・mBDSR】
Methods and case studies (PDF) ★GogoJungle AWARD2020 winner★
https://www.gogojungle.co.jp/tools/indicators/11836
The PDFs include 301 files (over 1,000 pages in total, over 350,000 words).
Many of them describe examples that logically link higher and lower timeframes using three RCI lines, sequentially examining the status of multiple lower timeframes, and ultimately waiting for pullbacks in the lower timeframes (i.e., signals of mBDSR) at timing for buying on dips or selling on rallies.
In addition,many emphasize identifying points where multiple entry reasons coincide..
The explanations usemore than 1,000 charts.
× ![]()


