

[If you want to follow the trend...] Sign of mBDSR (Moving Average Filter) and GMMA from today's chart (July 24, 2024)
0
Indicator that captures tops and bottoms and reversals in combination with RCI【mBDSR】
and method・case studies (PDF) ★GogoJungle AWARD2020 winner★
https://www.gogojungle.co.jp/tools/indicators/11836
The above products include 301 PDFs (methods, case studies, etc.). For a list of titles of those PDFs, please refer to the article below.
About the 301 PDF files included with 【BODSOR・mBDSR】
https://www.gogojungle.co.jp/finance/navi/articles/34271
mBDSR (RCI filter)andmBDSR (Moving Average filter)serve different roles. The usage distinctions are also touched upon in the PDFs above.
Below,mBDSR (Moving Average filter)sign examples are introduced.
USDJPY 1-hour chart
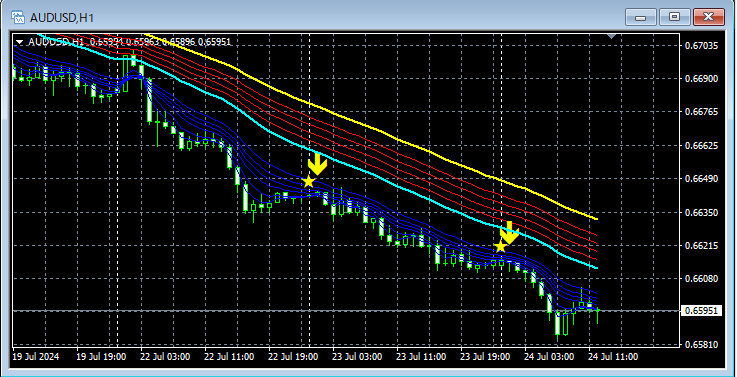
Sign of mBDSR (twoMovingAverage filters)andGMMA
GBP NZD 1-hour chart
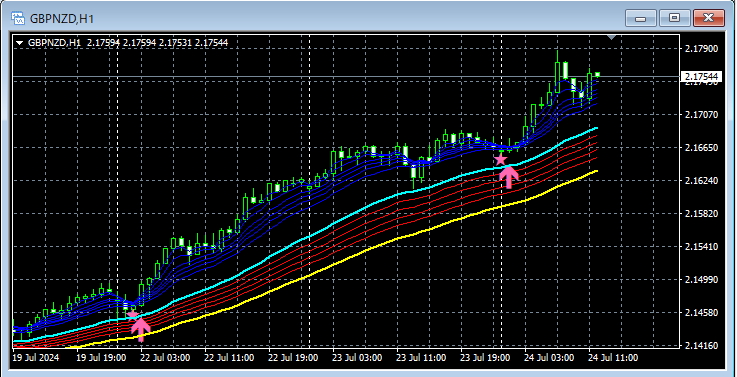
Sign of mBDSR (twoMovingAverage filters)andGMMA
EUR AUD 1-hour chart
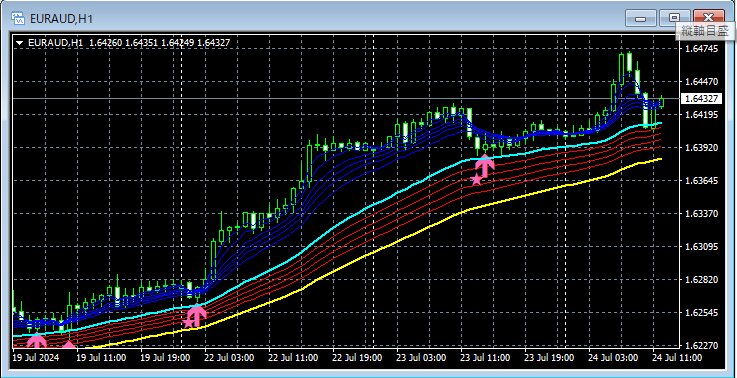
Sign of mBDSR (twoMovingAverage filters)andGMMA
GBP AUD 1-hour chart
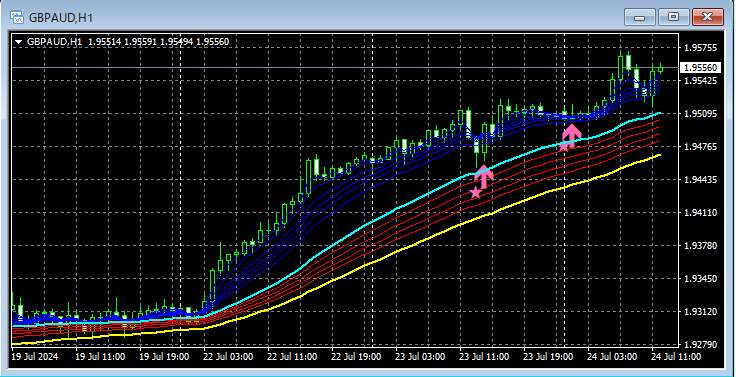
Sign of mBDSR (twoMovingAverage filters)andGMMA
AUD CAD 1-hour chart
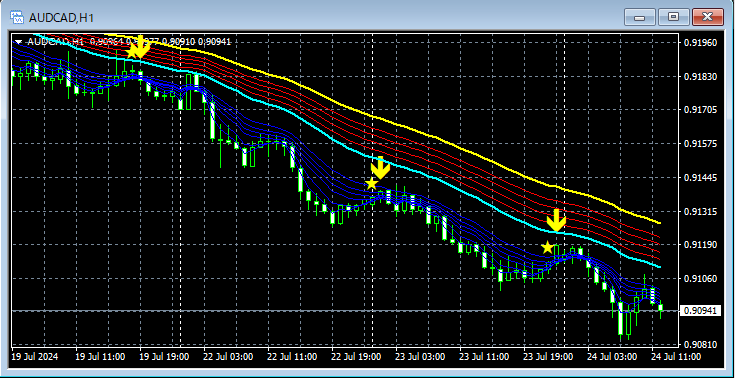
Sign of mBDSR (twoMovingAverage filters)andGMMA
NZD CAD 1-hour chart
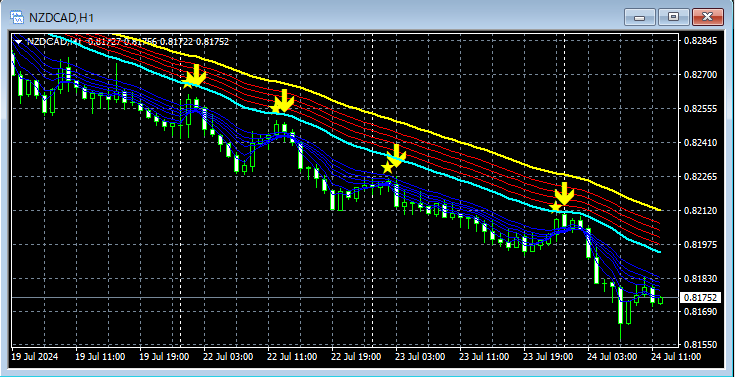
Sign of mBDSR (twoMovingAverage filters)andGMMA
AUD CHF 1-hour chart
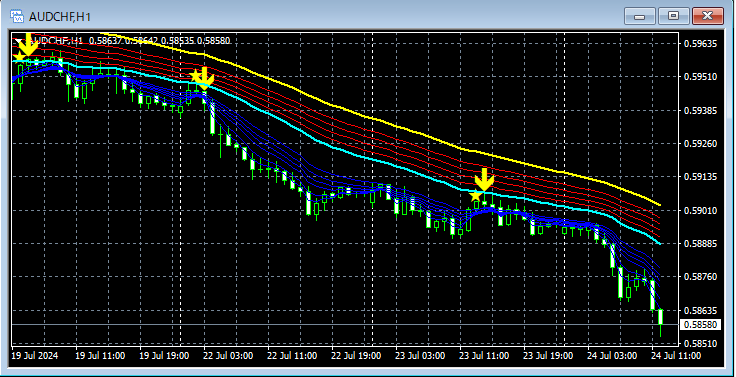
Sign of mBDSR (twoMovingAverage filters)andGMMA
Indicator【BODSOR・mBDSR】that shines in combination with RCI
and method・case studies (PDF) ★GogoJungle AWARD2020 winner★
https://www.gogojungle.co.jp/tools/indicators/11836
The PDF files amount to 301 (over 1,000 pages, over 350,000 characters in total).
Many of them are examples that lay out a process of logically linking higher and lower timeframes by using three RCI lines, sequentially examining the conditions of multiple lower timeframes, and ultimately waiting for the pullback buying or retracement selling timing (i.e., the mBDSR signal) on the lower timeframe.
Additionally,many focus on capturing points where multiple entry reasons overlap..
In the explanations,more than 1,000 chartsare used.

and method・case studies (PDF) ★GogoJungle AWARD2020 winner★
https://www.gogojungle.co.jp/tools/indicators/11836
The above products include 301 PDFs (methods, case studies, etc.). For a list of titles of those PDFs, please refer to the article below.
About the 301 PDF files included with 【BODSOR・mBDSR】
https://www.gogojungle.co.jp/finance/navi/articles/34271
mBDSR (RCI filter)andmBDSR (Moving Average filter)serve different roles. The usage distinctions are also touched upon in the PDFs above.
Below,mBDSR (Moving Average filter)sign examples are introduced.
USDJPY 1-hour chart
Sign of mBDSR (twoMovingAverage filters)andGMMA
GBP NZD 1-hour chart
Sign of mBDSR (twoMovingAverage filters)andGMMA
EUR AUD 1-hour chart
Sign of mBDSR (twoMovingAverage filters)andGMMA
GBP AUD 1-hour chart
Sign of mBDSR (twoMovingAverage filters)andGMMA
AUD CAD 1-hour chart
Sign of mBDSR (twoMovingAverage filters)andGMMA
NZD CAD 1-hour chart
Sign of mBDSR (twoMovingAverage filters)andGMMA
AUD CHF 1-hour chart
Sign of mBDSR (twoMovingAverage filters)andGMMA
Indicator【BODSOR・mBDSR】that shines in combination with RCI
and method・case studies (PDF) ★GogoJungle AWARD2020 winner★
https://www.gogojungle.co.jp/tools/indicators/11836
The PDF files amount to 301 (over 1,000 pages, over 350,000 characters in total).
Many of them are examples that lay out a process of logically linking higher and lower timeframes by using three RCI lines, sequentially examining the conditions of multiple lower timeframes, and ultimately waiting for the pullback buying or retracement selling timing (i.e., the mBDSR signal) on the lower timeframe.
Additionally,many focus on capturing points where multiple entry reasons overlap..
In the explanations,more than 1,000 chartsare used.
× ![]()


