

[Pattern aiming for a triple-top/three-peak formation] Look for signs of a pullback using RCI and mBDSR
Indicator that captures the bottom/top reversal in combination with RCI: 【mBDSR】
Methods & Case Studies (PDF) ★GogoJungle AWARD2020 Winner★
https://www.gogojungle.co.jp/tools/indicators/11836
The above product includes 301 PDFs (methods, case studies, etc.). For a list of the PDF titles, please see the article below.
About the 301 PDF files included with the 【BODSOR・mBDSR】
https://www.gogojungle.co.jp/finance/navi/articles/34271
Pound Swiss Franc – 4-hour timeframe
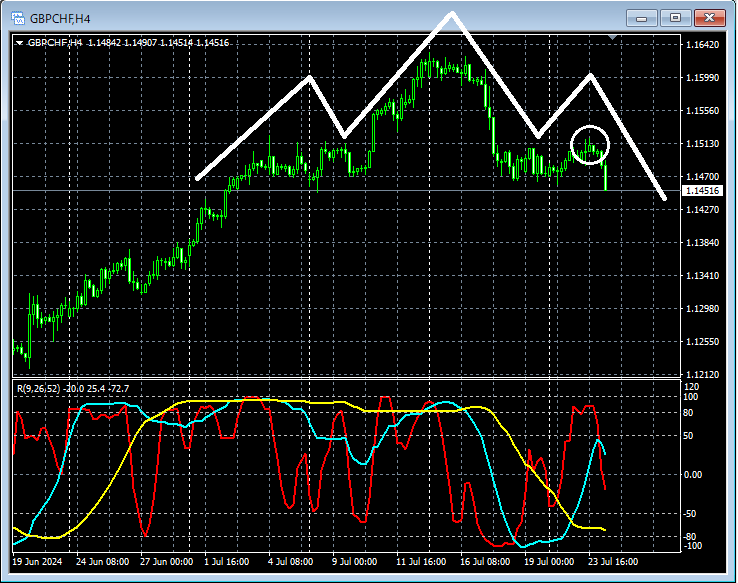
The higher time-frame situation is omitted. On the 4-hour chart above,we aim for a Head and Shoulders patternto form.Level that could become the right shoulder of the head and shouldersWe will look for signs of a reversal nearby (around the white circled area) on the lower timeframes.
Pound Swiss Franc – 5-minute chart
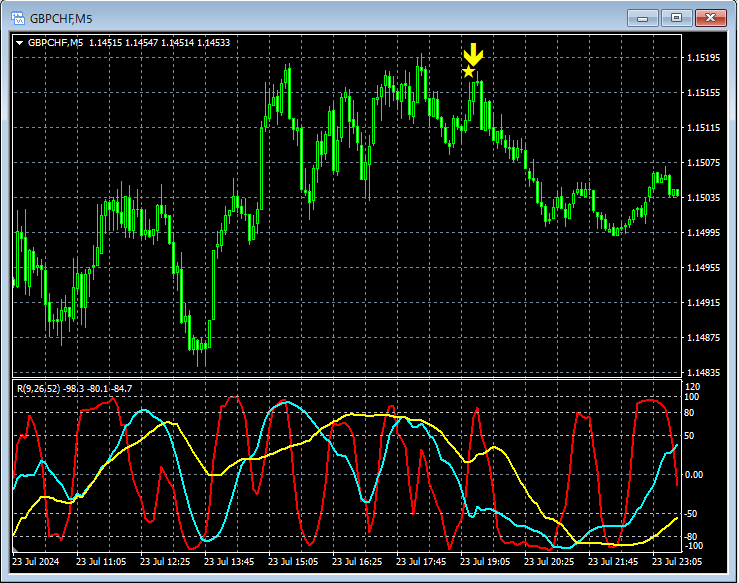
Looking at the upper 5-minute chart,the level that could become the right shoulder of the head and shouldersis nearbymBDSR (Filter: RCI26 and RCI52) Sell-off signalhas illuminated and the price has dropped significantly.
From this example,a trading method aiming to form a head and shouldersandthe signal of mBDSRshow strong compatibility.
Additionally, in this example, placing the stop-loss a little above the recent highcan yield a favorable risk-reward trade
Indicator that shines when combined with RCI: 【BODSOR・mBDSR】
Methods & Case Studies (PDF) ★GogoJungle AWARD2020 Winner★
https://www.gogojungle.co.jp/tools/indicators/11836
The PDF files include 301 items (over 1,000 pages, over 350,000 characters in total).
Most of them aresummaries of how to logically link higher and lower timeframes using three RCI lines, gradually considering the status of multiple lower timeframes, and ultimately waiting for an entry timing on the lower timeframes (i.e., mBDSR signals) for a pullback buy or a return sellas examples.
Additionally,many focus on identifying points where multiple entry reasons overlapas central themes.
In the explanations,over 1,000 chartsare used.

Methods & Case Studies (PDF) ★GogoJungle AWARD2020 Winner★
https://www.gogojungle.co.jp/tools/indicators/11836
The above product includes 301 PDFs (methods, case studies, etc.). For a list of the PDF titles, please see the article below.
About the 301 PDF files included with the 【BODSOR・mBDSR】
https://www.gogojungle.co.jp/finance/navi/articles/34271
Pound Swiss Franc – 4-hour timeframe
The higher time-frame situation is omitted. On the 4-hour chart above,we aim for a Head and Shoulders patternto form.Level that could become the right shoulder of the head and shouldersWe will look for signs of a reversal nearby (around the white circled area) on the lower timeframes.
Pound Swiss Franc – 5-minute chart
Looking at the upper 5-minute chart,the level that could become the right shoulder of the head and shouldersis nearbymBDSR (Filter: RCI26 and RCI52) Sell-off signalhas illuminated and the price has dropped significantly.
From this example,a trading method aiming to form a head and shouldersandthe signal of mBDSRshow strong compatibility.
Additionally, in this example, placing the stop-loss a little above the recent highcan yield a favorable risk-reward trade
Indicator that shines when combined with RCI: 【BODSOR・mBDSR】
Methods & Case Studies (PDF) ★GogoJungle AWARD2020 Winner★
https://www.gogojungle.co.jp/tools/indicators/11836
The PDF files include 301 items (over 1,000 pages, over 350,000 characters in total).
Most of them aresummaries of how to logically link higher and lower timeframes using three RCI lines, gradually considering the status of multiple lower timeframes, and ultimately waiting for an entry timing on the lower timeframes (i.e., mBDSR signals) for a pullback buy or a return sellas examples.
Additionally,many focus on identifying points where multiple entry reasons overlapas central themes.
In the explanations,over 1,000 chartsare used.
× ![]()


