

Common pattern: Signs of rebound near the moving average that is deemed important [Example of using mBDSR (RCI two-filter)]
Indicator that captures “top and bottom and reversal” in combination with RCI: 【mBDSR】
Methods and Case Studies (PDF) ★GogoJungle AWARD2020 Winner★
https://www.gogojungle.co.jp/tools/indicators/11836
The above products include 301 PDFs (methods, case studies, etc.). For a list of the titles of those PDFs, please see the article below.
Regarding the 301 PDF files included with 【BODSOR・mBDSR】
https://www.gogojungle.co.jp/finance/navi/articles/34271
EUR/USD – 5-minute chart
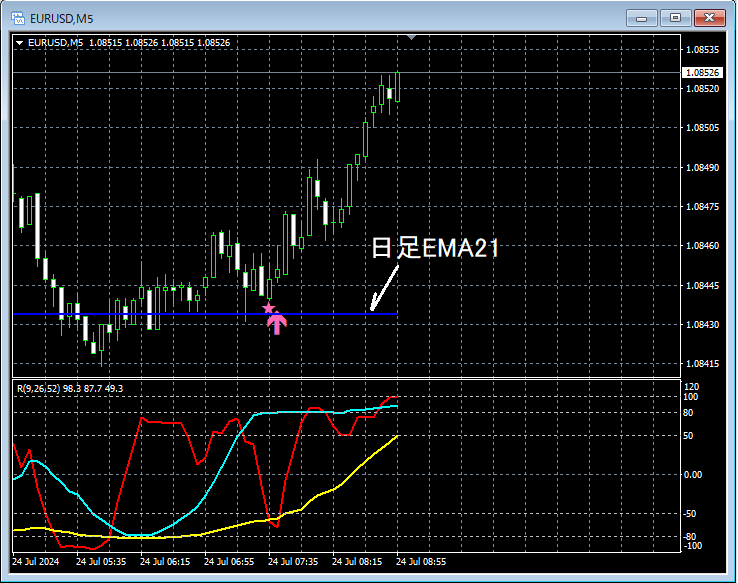
In this example,Daily EMA21is unable to clearly break below,mBDSR (filter: RCI26 and RCI52) pullback buying signallights up and rebounds.
AUD/CAD – 5-minute chart
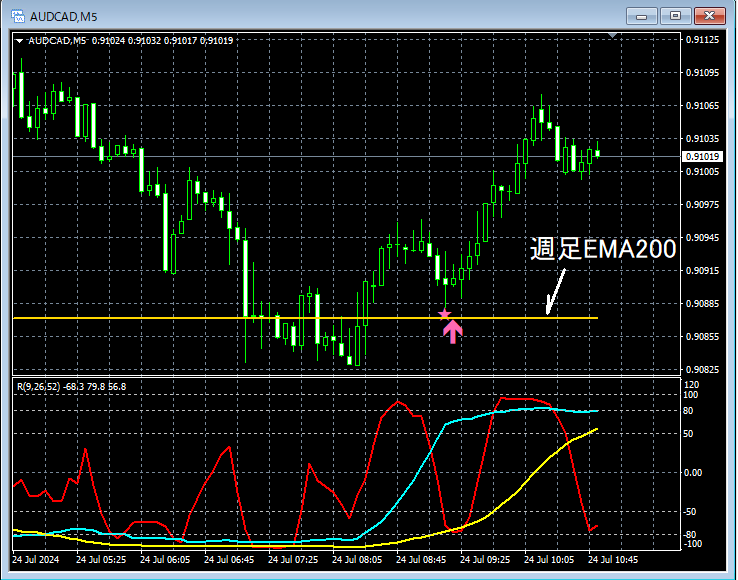
In this example,Weekly EMA200is unable to clearly break below,mBDSR (filter: RCI26 and RCI52) pullback buying signallights up and rebounds.
The indicator 【BODSOR・mBDSR】 that shines in combination with RCI
Methods and Case Studies (PDF) ★GogoJungle AWARD2020 Winner★
https://www.gogojungle.co.jp/tools/indicators/11836
The PDF files include 301 files (over 1,000 pages, over 350,000 characters in total).
Many of them are about how to logically link higher and lower timeframes using three lines of RCI to sequentially analyze multiple lower timeframes and ultimately wait for pullback buying or pullback selling signals on the lower timeframe (i.e., the mBDSR signals).They are.
Also,many focus on capturing points where multiple entry reasons overlap.There are many.
In the explanations,more than 1,000 chartswere used.

Methods and Case Studies (PDF) ★GogoJungle AWARD2020 Winner★
https://www.gogojungle.co.jp/tools/indicators/11836
The above products include 301 PDFs (methods, case studies, etc.). For a list of the titles of those PDFs, please see the article below.
Regarding the 301 PDF files included with 【BODSOR・mBDSR】
https://www.gogojungle.co.jp/finance/navi/articles/34271
EUR/USD – 5-minute chart
In this example,Daily EMA21is unable to clearly break below,mBDSR (filter: RCI26 and RCI52) pullback buying signallights up and rebounds.
AUD/CAD – 5-minute chart
In this example,Weekly EMA200is unable to clearly break below,mBDSR (filter: RCI26 and RCI52) pullback buying signallights up and rebounds.
The indicator 【BODSOR・mBDSR】 that shines in combination with RCI
Methods and Case Studies (PDF) ★GogoJungle AWARD2020 Winner★
https://www.gogojungle.co.jp/tools/indicators/11836
The PDF files include 301 files (over 1,000 pages, over 350,000 characters in total).
Many of them are about how to logically link higher and lower timeframes using three lines of RCI to sequentially analyze multiple lower timeframes and ultimately wait for pullback buying or pullback selling signals on the lower timeframe (i.e., the mBDSR signals).They are.
Also,many focus on capturing points where multiple entry reasons overlap.There are many.
In the explanations,more than 1,000 chartswere used.
× ![]()


