

[Chart Study] Horizontal Line (Previous High on Higher Timeframe) and mBDSR (RCI 2-line Filter) Short Selling Signal
Indicator that captures the bottom/top using RCI in combination with "Design to Capture Bottoms and Reversals" [mBDSR]
Method and Case Studies (PDF) ★GogoJungle AWARD 2020 winner★
https://www.gogojungle.co.jp/tools/indicators/11836
The above products include 301 PDFs. For a list of their PDF titles, please see the article below.
About the 301 PDF files included with 【BODSOR・mBDSR】
https://www.gogojungle.co.jp/finance/navi/articles/34271
Pound/Nz Dollar - Monthly Chart
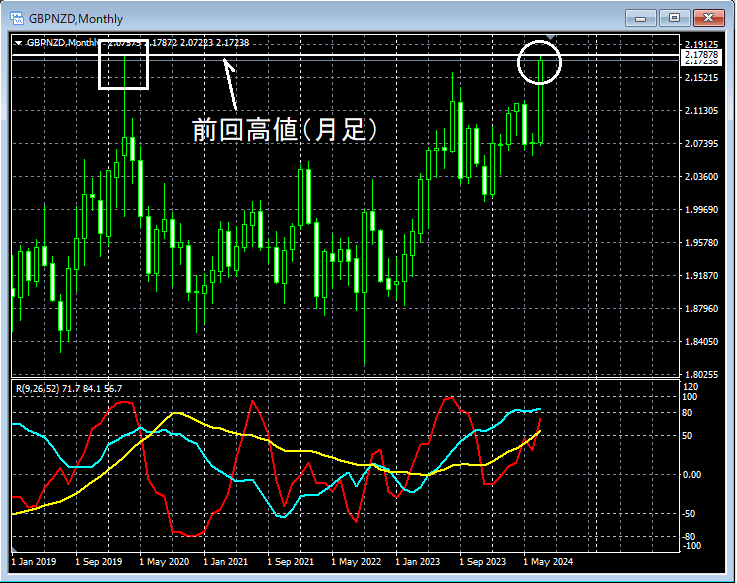
Looking at the area encircled in white on the monthly chart above,there is a rise toward the line indicating the previous high (horizontal line)If this line comes to be treated as resistance, it might be a scenario where selling on retracements could be appropriate. We will carefully observe for signs of rejection on lower time frames.
Pound/Nz Dollar - 15-minute chart
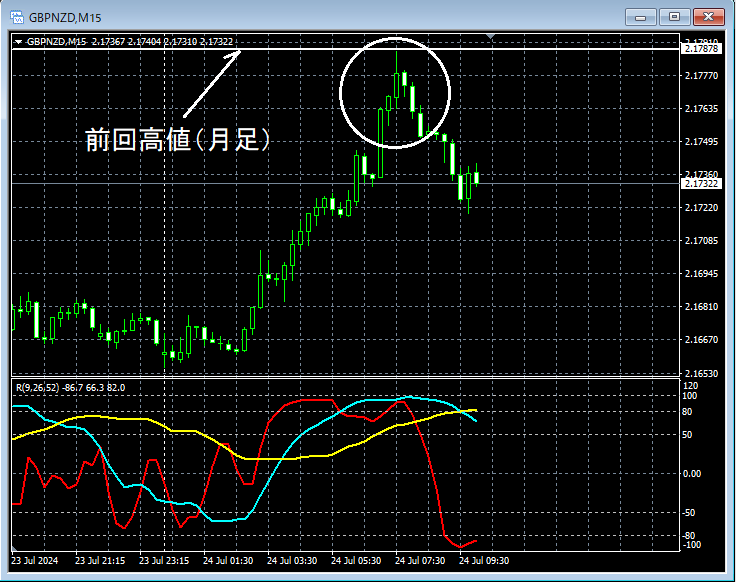
We will further examine the area encircled in white on the 15-minute chart using an even lower time frame (1-minute chart).
Euro/Dollar - 1-minute chart
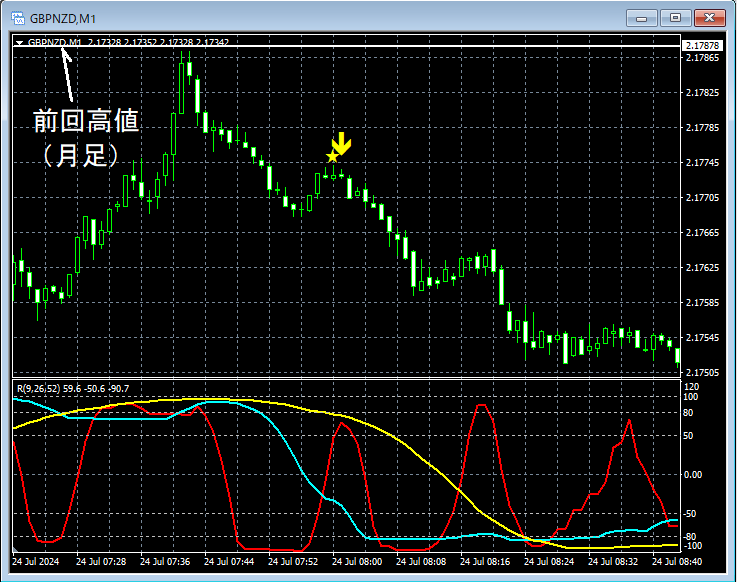
When viewed on the 1-minute chart above,the line indicating the previous high at the monthly levelis approached and reverses,the mBDSR (Filter: RCI26 and RCI52) sell signallights up, and the price continues to fall.
From this example,there is a strong compatibility between trading that focuses on the previous high (horizontal line)andthe mBDSR signal.
Indicator that shines when combined with RCI: 【BODSOR・mBDSR】
Method and Case Studies (PDF) ★GogoJungle AWARD 2020 winner★
https://www.gogojungle.co.jp/tools/indicators/11836
The PDFs include 301 files (over 1,000 pages, over 350,000 characters).
Many of them are examples that summarize how to logically link higher and lower time frames using three RCI lines, sequentially considering the states of multiple lower time frames, and ultimately waiting for timing to buy on dips or sell on rallies on the lower time frames with mBDSR signals.
Also,many focus on capturing points where multiple entry reasons overlap..
The explanations useover 1,000 charts.

Method and Case Studies (PDF) ★GogoJungle AWARD 2020 winner★
https://www.gogojungle.co.jp/tools/indicators/11836
The above products include 301 PDFs. For a list of their PDF titles, please see the article below.
About the 301 PDF files included with 【BODSOR・mBDSR】
https://www.gogojungle.co.jp/finance/navi/articles/34271
Pound/Nz Dollar - Monthly Chart
Looking at the area encircled in white on the monthly chart above,there is a rise toward the line indicating the previous high (horizontal line)If this line comes to be treated as resistance, it might be a scenario where selling on retracements could be appropriate. We will carefully observe for signs of rejection on lower time frames.
Pound/Nz Dollar - 15-minute chart
We will further examine the area encircled in white on the 15-minute chart using an even lower time frame (1-minute chart).
Euro/Dollar - 1-minute chart
When viewed on the 1-minute chart above,the line indicating the previous high at the monthly levelis approached and reverses,the mBDSR (Filter: RCI26 and RCI52) sell signallights up, and the price continues to fall.
From this example,there is a strong compatibility between trading that focuses on the previous high (horizontal line)andthe mBDSR signal.
Indicator that shines when combined with RCI: 【BODSOR・mBDSR】
Method and Case Studies (PDF) ★GogoJungle AWARD 2020 winner★
https://www.gogojungle.co.jp/tools/indicators/11836
The PDFs include 301 files (over 1,000 pages, over 350,000 characters).
Many of them are examples that summarize how to logically link higher and lower time frames using three RCI lines, sequentially considering the states of multiple lower time frames, and ultimately waiting for timing to buy on dips or sell on rallies on the lower time frames with mBDSR signals.
Also,many focus on capturing points where multiple entry reasons overlap..
The explanations useover 1,000 charts.
× ![]()


