

[Today's USD/JPY Strategy] Follow the trend on the higher timeframe and aim for trend reversals on the lower timeframe. Role distribution of mBDSR (RCI two-filter and MA two-filter). July 24, 2024
An Indicator that Captures Tops/Bottoms with RCI Combination: “mBDSR”
Methods and Case Studies (PDF) ★GogoJungle AWARD2020 Winner★
https://www.gogojungle.co.jp/tools/indicators/11836
The above product includes 301 PDFs (methods, case studies, etc.). For the lists of PDF titles, please refer to the article below.
About the 301 PDF files included with 【BODSOR・mBDSR】
https://www.gogojungle.co.jp/finance/navi/articles/34271
mBDSR (RCI Filter)andmBDSR (Moving Average Filter)have different roles. The usage distinctions are also mentioned in the PDFs above.
Below,mBDSR (Two RCI Filters)andmBDSR (Two MA Filters)will be shown with example signals.
USDJPY 1-Hour
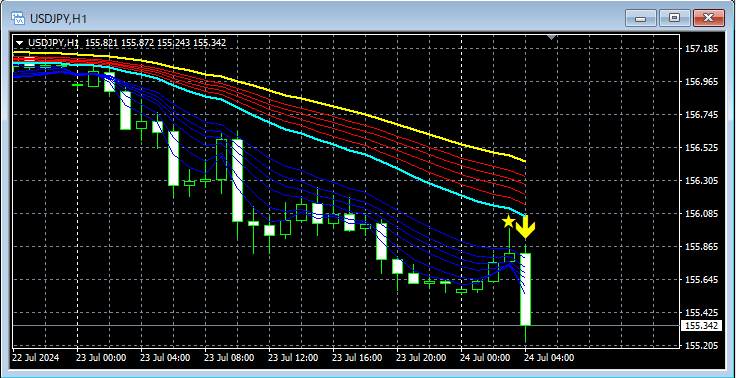
Signals of mBDSR (Two MA Filters)andGMMA
In the 1-hour chart above,the return-selling signal of mBDSR (Two MA Filters)lights up. It effectively captures the timing of pullbacks in a downtrend.
USDJPY 1-Minute
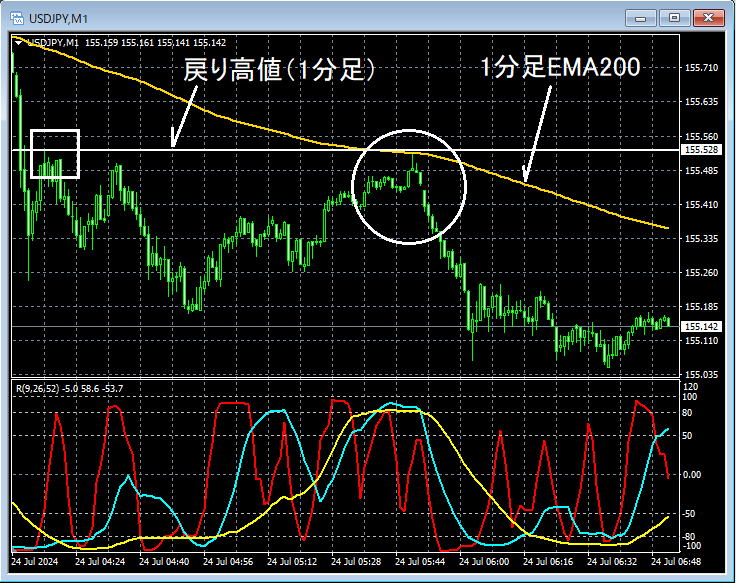
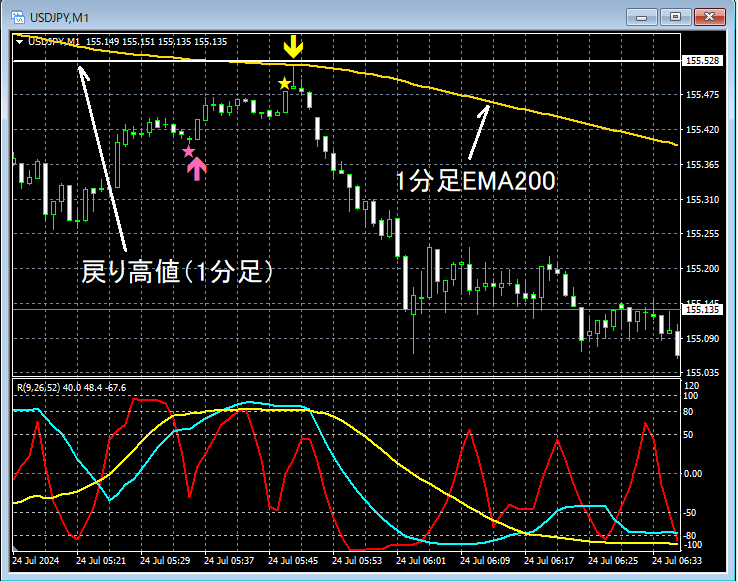
mBDSR (RCI Two-Filter)signal
Here, we will continue from the previous 1-hour chart and look at the 1-minute chart. In the 1-minute chart above,1-minute EMA200and1-minute level pullback highoverlap around herethe mBDSR (RCI Two-Filter) return-selling signallights up and reverses. It successfully captures the trend reversal (downtrend) at the 1-minute level.
An Indicator that Delivers Potent Results in Combination with RCI: 【BODSOR・mBDSR】
Methods and Case Studies (PDF) ★GogoJungle AWARD2020 Winner★
https://www.gogojungle.co.jp/tools/indicators/11836
The PDF files total 301 items (over 1,000 pages, over 350,000 characters).
Many of them are examples that explain how to logically link higher and lower timeframes using three RCI lines, sequentially analyze multiple lower timeframes, and ultimately wait for pullbacks or pullback entries (i.e., mBDSR signals) on the lower timeframe.In addition,
there are many resources focused on identifying points where multiple entry signals coincide..
Explanation usesmore than 1,000 charts.

Methods and Case Studies (PDF) ★GogoJungle AWARD2020 Winner★
https://www.gogojungle.co.jp/tools/indicators/11836
The above product includes 301 PDFs (methods, case studies, etc.). For the lists of PDF titles, please refer to the article below.
About the 301 PDF files included with 【BODSOR・mBDSR】
https://www.gogojungle.co.jp/finance/navi/articles/34271
mBDSR (RCI Filter)andmBDSR (Moving Average Filter)have different roles. The usage distinctions are also mentioned in the PDFs above.
Below,mBDSR (Two RCI Filters)andmBDSR (Two MA Filters)will be shown with example signals.
USDJPY 1-Hour
Signals of mBDSR (Two MA Filters)andGMMA
In the 1-hour chart above,the return-selling signal of mBDSR (Two MA Filters)lights up. It effectively captures the timing of pullbacks in a downtrend.
USDJPY 1-Minute
mBDSR (RCI Two-Filter)signal
Here, we will continue from the previous 1-hour chart and look at the 1-minute chart. In the 1-minute chart above,1-minute EMA200and1-minute level pullback highoverlap around herethe mBDSR (RCI Two-Filter) return-selling signallights up and reverses. It successfully captures the trend reversal (downtrend) at the 1-minute level.
An Indicator that Delivers Potent Results in Combination with RCI: 【BODSOR・mBDSR】
Methods and Case Studies (PDF) ★GogoJungle AWARD2020 Winner★
https://www.gogojungle.co.jp/tools/indicators/11836
The PDF files total 301 items (over 1,000 pages, over 350,000 characters).
Many of them are examples that explain how to logically link higher and lower timeframes using three RCI lines, sequentially analyze multiple lower timeframes, and ultimately wait for pullbacks or pullback entries (i.e., mBDSR signals) on the lower timeframe.In addition,
there are many resources focused on identifying points where multiple entry signals coincide..
Explanation usesmore than 1,000 charts.
× ![]()


