

Double top, trendline, moving average, and mBDSR (RCI two-filter) short-signal on pullback
Indicator that captures the bottom, reversal when combined with RCI: 【mBDSR】
Methods and Case Studies (PDF) ★GogoJungle AWARD2020 Winner★
https://www.gogojungle.co.jp/tools/indicators/11836
The above product includes 301 PDFs (methods, case studies, etc.). For a list of the titles of those PDFs, please see the article below.
Regarding the 301 PDF files included with 【BODSOR・mBDSR】
https://www.gogojungle.co.jp/finance/navi/articles/34271
AUDCHF 4-hour chart
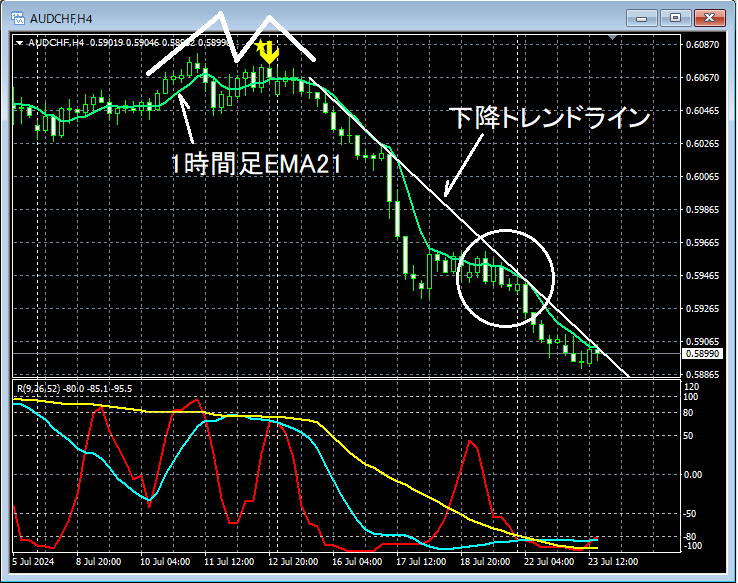
In the 4-hour chart above,the right peak of the double topisthe mBDSR (two RCI filters) sell-back signallighting up and starting the downtrend. Here, we will look for a selling entry on lower time frames.Downtrend lineandthe overlap area with 1-hour EMA21(circled in white) will be examined on the lower time frame.
AUDCHF 1-hour chart
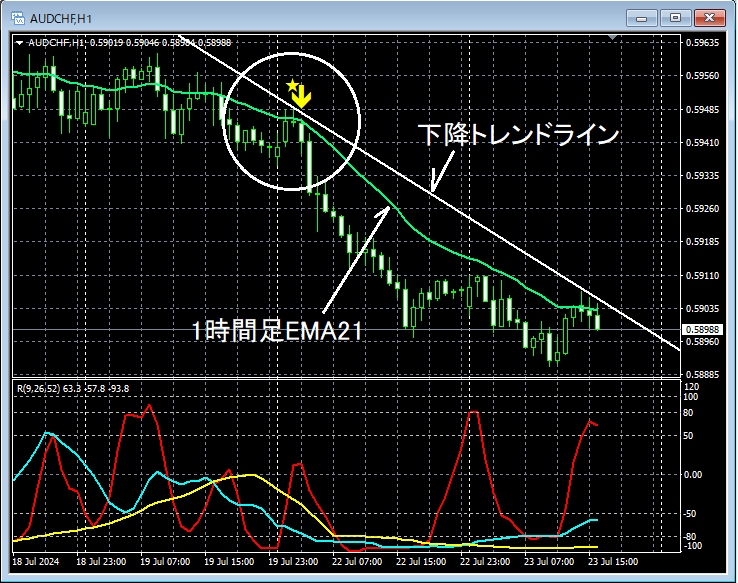
In the 1-hour chart above,the downtrend lineandthe overlap area with 1-hour EMA21have themBDSR (two RCI filter) sell-back signalilluminate, and the price is seen to drop sharply.
From this example,there is clear synergy between trade techniques focusing on double tops, trendlines, and moving averagesandthe signals of mBDSR.
An indicator that shines when combined with RCI: 【BODSOR・mBDSR】
Methods and Case Studies (PDF) ★GogoJungle AWARD2020 Winner★
https://www.gogojungle.co.jp/tools/indicators/11836
The PDFs include 301 files (over 1,000 pages in total, over 350,000 characters).
Most of them areexamples organized around logically linking the upper and lower timeframes using the RCI3 lines, moving through the various lower-timeframe conditions, and ultimately waiting for a buying opportunity at a pullback or a selling-back timing on the lower timeframe (i.e., the mBDSR signal)..
Additionally,many focus on identifying points where multiple entry reasons overlap..
In the explanations,more than 1,000 chartsare used.

Methods and Case Studies (PDF) ★GogoJungle AWARD2020 Winner★
https://www.gogojungle.co.jp/tools/indicators/11836
The above product includes 301 PDFs (methods, case studies, etc.). For a list of the titles of those PDFs, please see the article below.
Regarding the 301 PDF files included with 【BODSOR・mBDSR】
https://www.gogojungle.co.jp/finance/navi/articles/34271
AUDCHF 4-hour chart
In the 4-hour chart above,the right peak of the double topisthe mBDSR (two RCI filters) sell-back signallighting up and starting the downtrend. Here, we will look for a selling entry on lower time frames.Downtrend lineandthe overlap area with 1-hour EMA21(circled in white) will be examined on the lower time frame.
AUDCHF 1-hour chart
In the 1-hour chart above,the downtrend lineandthe overlap area with 1-hour EMA21have themBDSR (two RCI filter) sell-back signalilluminate, and the price is seen to drop sharply.
From this example,there is clear synergy between trade techniques focusing on double tops, trendlines, and moving averagesandthe signals of mBDSR.
An indicator that shines when combined with RCI: 【BODSOR・mBDSR】
Methods and Case Studies (PDF) ★GogoJungle AWARD2020 Winner★
https://www.gogojungle.co.jp/tools/indicators/11836
The PDFs include 301 files (over 1,000 pages in total, over 350,000 characters).
Most of them areexamples organized around logically linking the upper and lower timeframes using the RCI3 lines, moving through the various lower-timeframe conditions, and ultimately waiting for a buying opportunity at a pullback or a selling-back timing on the lower timeframe (i.e., the mBDSR signal)..
Additionally,many focus on identifying points where multiple entry reasons overlap..
In the explanations,more than 1,000 chartsare used.
× ![]()


