

Australian Dollar / Japanese Yen [If you chase the trend...] mBDSR (Moving Average Filter) signal and GMMA from yesterday's chart (July 23, 2024)
Indicator that captures “tops/bottoms and reversals” in combination with RCI: 【mBDSR】
Methods and Case Studies (PDF) ★GogoJungle AWARD2020 Winner★
https://www.gogojungle.co.jp/tools/indicators/11836
The above products include 301 PDFs (methods, case studies, etc.). For a list of the titles of those PDFs, please refer to the article below.
About the 301 PDF files included with 【BODSOR・mBDSR】
https://www.gogojungle.co.jp/finance/navi/articles/34271
mBDSR (RCI filter)andmBDSR (Moving Average Filter)have different roles. The usage distinctions are also discussed in the PDFs above.
Below, we present examples of signals frommBDSR (Moving Average Filter)on 4-hour, 1-hour, 30-minute, and 15-minute charts of AUDJPY at nearly the same time.
AUD/JPY 4-hour
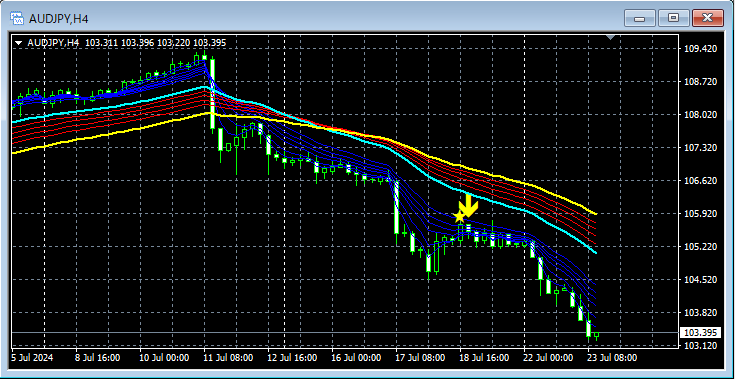
Signals from mBDSR (2 moving average filters)andGMMA
AUD/JPY 1-hour
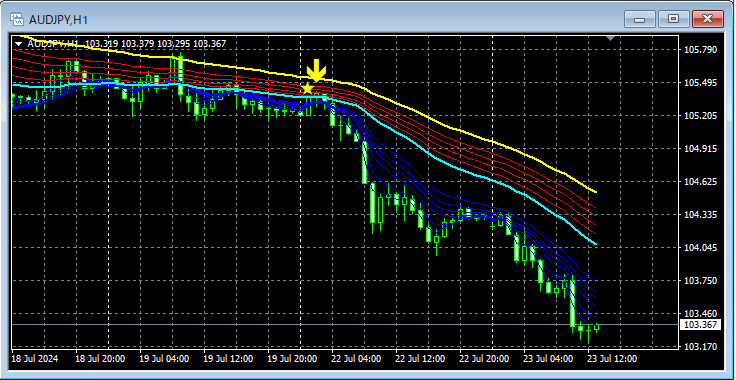
Signals from mBDSR (2 moving average filters)andGMMA
AUD/JPY 30-minute
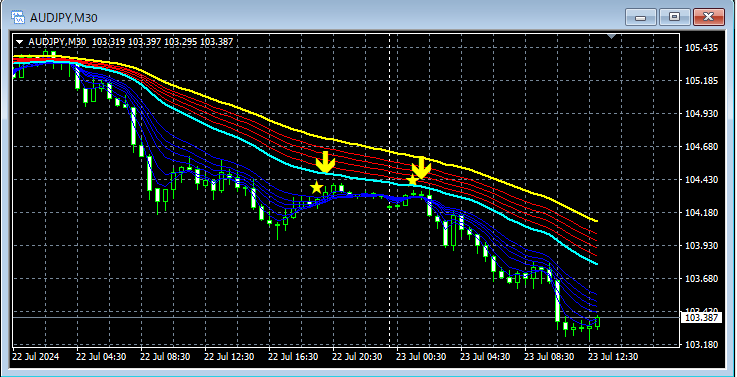
Signals from mBDSR (2 moving average filters)andGMMA
AUD/JPY 15-minute
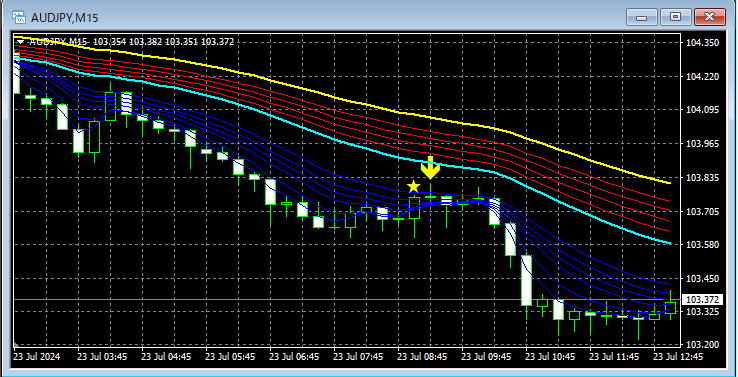
Signals from mBDSR (2 moving average filters)andGMMA
In the above examples, at each time frame,signals from mBDSR (2 moving average filters)clearly capture optimal timing for pullback selling.
Indicator that excels when combined with RCI: 【BODSOR・mBDSR】
Methods and Case Studies (PDF) ★GogoJungle AWARD2020 Winner★
https://www.gogojungle.co.jp/tools/indicators/11836
The PDF files total 301 (over 1,000 pages, over 350,000 characters).
Many of them describe how to logically connect higher and lower timeframes using the three RCI lines to examine multiple lower-timeframe conditions successively, and finally wait for pullbacks or rebounds on the lower timeframes (i.e., the signals from mBDSR).
Also,many focus on identifying points where multiple entry rationale overlap..
In the explanations,over 1,000 chartsare used.

Methods and Case Studies (PDF) ★GogoJungle AWARD2020 Winner★
https://www.gogojungle.co.jp/tools/indicators/11836
The above products include 301 PDFs (methods, case studies, etc.). For a list of the titles of those PDFs, please refer to the article below.
About the 301 PDF files included with 【BODSOR・mBDSR】
https://www.gogojungle.co.jp/finance/navi/articles/34271
mBDSR (RCI filter)andmBDSR (Moving Average Filter)have different roles. The usage distinctions are also discussed in the PDFs above.
Below, we present examples of signals frommBDSR (Moving Average Filter)on 4-hour, 1-hour, 30-minute, and 15-minute charts of AUDJPY at nearly the same time.
AUD/JPY 4-hour
Signals from mBDSR (2 moving average filters)andGMMA
AUD/JPY 1-hour
Signals from mBDSR (2 moving average filters)andGMMA
AUD/JPY 30-minute
Signals from mBDSR (2 moving average filters)andGMMA
AUD/JPY 15-minute
Signals from mBDSR (2 moving average filters)andGMMA
In the above examples, at each time frame,signals from mBDSR (2 moving average filters)clearly capture optimal timing for pullback selling.
Indicator that excels when combined with RCI: 【BODSOR・mBDSR】
Methods and Case Studies (PDF) ★GogoJungle AWARD2020 Winner★
https://www.gogojungle.co.jp/tools/indicators/11836
The PDF files total 301 (over 1,000 pages, over 350,000 characters).
Many of them describe how to logically connect higher and lower timeframes using the three RCI lines to examine multiple lower-timeframe conditions successively, and finally wait for pullbacks or rebounds on the lower timeframes (i.e., the signals from mBDSR).
Also,many focus on identifying points where multiple entry rationale overlap..
In the explanations,over 1,000 chartsare used.
× ![]()


