

[Chart Pattern] Return Sell Signal: Previous high (higher timeframe) and pullback low, counter-trend line, and mBDSR (RCI 2-line filter) overbought/oversold signal
Indicator that captures “tops/bottoms and reversals” in combination with RCI【mBDSR】
Methods and Case Studies (PDF) ★GogoJungle AWARD2020 Winner★
https://www.gogojungle.co.jp/tools/indicators/11836
The above products include 301 PDFs (methods, case studies, etc.). For lists of the titles of those PDFs, please see the article below.
About the 301 PDF files included with 【BODSOR・mBDSR】
https://www.gogojungle.co.jp/finance/navi/articles/34271
USD/CAD 5-minute chart
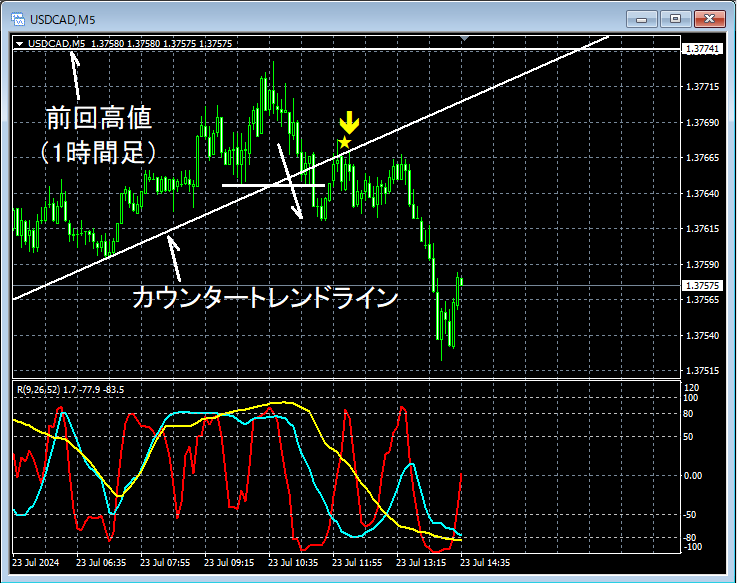
The higher-timeframe chart is omitted. On the above 5-minute chart,the previous high (hourly level) was not reached and price reversed.Break of the pullback low and counter-trend line
From this example,a trading method focusing on previous highs, pullback lows, and counter-trend linesandsignals from mBDSRshow a high degree of compatibility.
Indicator that excels when combined with RCI: 【BODSOR・mBDSR】
Methods and Case Studies (PDF) ★GogoJungle AWARD2020 Winner★
https://www.gogojungle.co.jp/tools/indicators/11836
The PDF files come with 301 items.
Many of them are aboutusing three RCI lines to logically link higher and lower timeframes, sequentially examining multiple lower timeframes, and ultimately waiting for pullback buys or pullback sells on the lower timeframes (i.e., mBDSR signals)in summary.
Additionally,they place emphasis on capturing points where multiple entry criteria coincide.There are many such cases.
In the explanations,over 1,000 chartsare used.

Methods and Case Studies (PDF) ★GogoJungle AWARD2020 Winner★
https://www.gogojungle.co.jp/tools/indicators/11836
The above products include 301 PDFs (methods, case studies, etc.). For lists of the titles of those PDFs, please see the article below.
About the 301 PDF files included with 【BODSOR・mBDSR】
https://www.gogojungle.co.jp/finance/navi/articles/34271
USD/CAD 5-minute chart
The higher-timeframe chart is omitted. On the above 5-minute chart,the previous high (hourly level) was not reached and price reversed.Break of the pullback low and counter-trend line
From this example,a trading method focusing on previous highs, pullback lows, and counter-trend linesandsignals from mBDSRshow a high degree of compatibility.
Indicator that excels when combined with RCI: 【BODSOR・mBDSR】
Methods and Case Studies (PDF) ★GogoJungle AWARD2020 Winner★
https://www.gogojungle.co.jp/tools/indicators/11836
The PDF files come with 301 items.
Many of them are aboutusing three RCI lines to logically link higher and lower timeframes, sequentially examining multiple lower timeframes, and ultimately waiting for pullback buys or pullback sells on the lower timeframes (i.e., mBDSR signals)in summary.
Additionally,they place emphasis on capturing points where multiple entry criteria coincide.There are many such cases.
In the explanations,over 1,000 chartsare used.
× ![]()


