

[Chart Pattern] Double Top Neckline and mBDSR (RCI2 Filers) Rebound Sell Signal
Indicator that captures “tops/bottoms and reversals” in combination with RCI: 【mBDSR】
Methods & Case Studies (PDF) ★GogoJungle AWARD2020 winner★
https://www.gogojungle.co.jp/tools/indicators/11836
The above products include 301 PDFs (methods, case studies, etc.). Please refer to the article below for the list of PDF titles and other details.
About the 301 attached PDF files for 【BODSOR・mBDSR】
https://www.gogojungle.co.jp/finance/navi/articles/34271
Euro Canadian Dollar – 5-minute chart
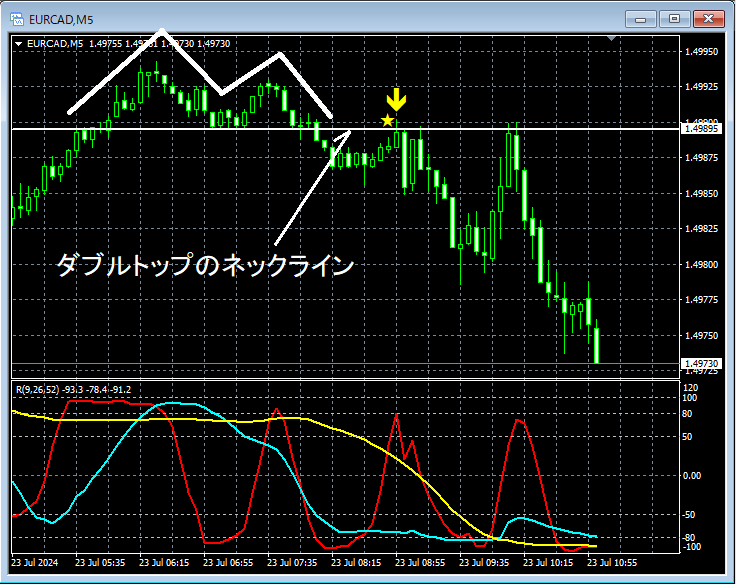
In the 5-minute chart above,the neck line of the double topis approached up to the vicinitythe return sell signal of mBDSR (two RCI filters)lights up, and thereafter it declines firmly.
From this example,a trading approach focused on double topsandthe signals of mBDSRshow a high degree of compatibility.
Indicator that shines when combined with RCI: 【BODSOR・mBDSR】
Methods & Case Studies (PDF) ★GogoJungle AWARD2020 winner★
https://www.gogojungle.co.jp/tools/indicators/11836
The PDF files are 301 in total.
Many of them explain a structure where multiple higher/lower timeframe relationships are logically linked using three RCI lines, and ultimately wait for pullback buying or pullback selling timing (=mBDSR signals) on lower timeframes.In other words, they are compiled into examples that illustrate this approach.
Also,many focus on identifying points where multiple entry reasons overlap..
In the explanations,over 1,000 chartsare used.

Methods & Case Studies (PDF) ★GogoJungle AWARD2020 winner★
https://www.gogojungle.co.jp/tools/indicators/11836
The above products include 301 PDFs (methods, case studies, etc.). Please refer to the article below for the list of PDF titles and other details.
About the 301 attached PDF files for 【BODSOR・mBDSR】
https://www.gogojungle.co.jp/finance/navi/articles/34271
Euro Canadian Dollar – 5-minute chart
In the 5-minute chart above,the neck line of the double topis approached up to the vicinitythe return sell signal of mBDSR (two RCI filters)lights up, and thereafter it declines firmly.
From this example,a trading approach focused on double topsandthe signals of mBDSRshow a high degree of compatibility.
Indicator that shines when combined with RCI: 【BODSOR・mBDSR】
Methods & Case Studies (PDF) ★GogoJungle AWARD2020 winner★
https://www.gogojungle.co.jp/tools/indicators/11836
The PDF files are 301 in total.
Many of them explain a structure where multiple higher/lower timeframe relationships are logically linked using three RCI lines, and ultimately wait for pullback buying or pullback selling timing (=mBDSR signals) on lower timeframes.In other words, they are compiled into examples that illustrate this approach.
Also,many focus on identifying points where multiple entry reasons overlap..
In the explanations,over 1,000 chartsare used.
× ![]()


