

【If you are chasing trends...】mBDSR (Moving Average Filter) signals and GMMA. Today's chart (July 23, 2024)
Indicator 【mBDSR】 that captures “tops/bottoms and reversals” in conjunction with RCI
and methodology / case studies (PDF) ★GogoJungle AWARD2020 winner★
https://www.gogojungle.co.jp/tools/indicators/11836
The above products include 301 PDFs (methods, case studies, etc.). For a list of PDF titles, please refer to the article below.
About the 301 PDF files included with 【BODSOR・mBDSR】
https://www.gogojungle.co.jp/finance/navi/articles/34271
mBDSR (RCI filter)andmBDSR (Moving Average Filter)have different roles. The usage distinctions are also described in the PDFs above.
Below, we introduce examples of signals from themBDSR (Moving Average Filter)on EUR/AUD across 1-hour, 30-minute, and 15-minute charts at nearly the same time.
EUR/AUD – 1-hour
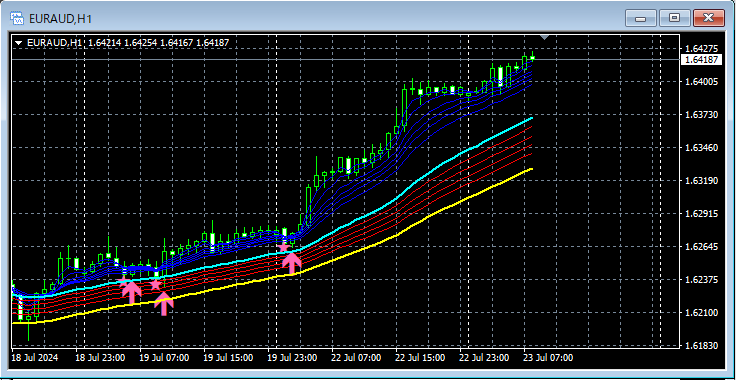
Signals from mBDSR (two moving average filters)andGMMA
EUR/AUD – 30-minute
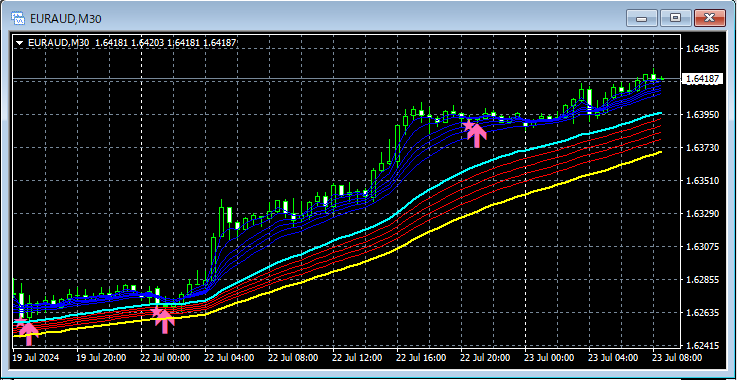
Signals from mBDSR (two moving average filters)andGMMA
EUR/AUD – 15-minute
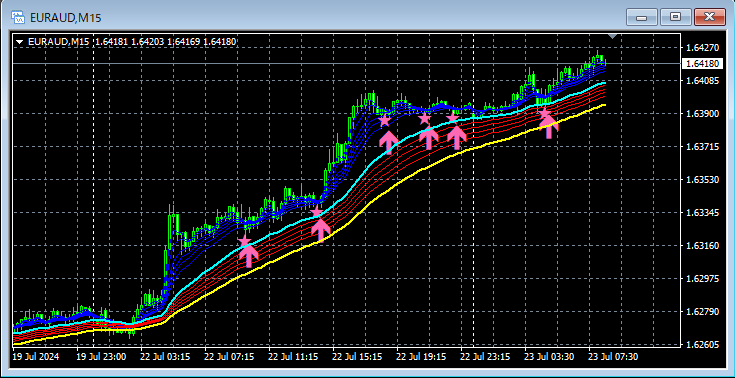
Signals from mBDSR (two moving average filters)andGMMA
In the above examples, at each time frame,signals from mBDSR (two moving average filters)effectively capture a pullback buying timing.
Indicator with powerful performance when combined with RCI: 【BODSOR・mBDSR】
and methodology / case studies (PDF) ★GogoJungle AWARD2020 winner★
https://www.gogojungle.co.jp/tools/indicators/11836
The PDF files include 301 files (over 1,000 pages, over 350,000 characters in total).
Many of these describe how to logically link higher and lower timeframes using the three RCI lines to progressively analyze multiple lower timeframes and, ultimately, to prepare for a pullback buying or pullback selling timing on the lower timeframes (i.e., signals from mBDSR).
Also,there are many that emphasize identifying points where multiple entry premises overlap.
The explanation usesover 1,000 charts.

and methodology / case studies (PDF) ★GogoJungle AWARD2020 winner★
https://www.gogojungle.co.jp/tools/indicators/11836
The above products include 301 PDFs (methods, case studies, etc.). For a list of PDF titles, please refer to the article below.
About the 301 PDF files included with 【BODSOR・mBDSR】
https://www.gogojungle.co.jp/finance/navi/articles/34271
mBDSR (RCI filter)andmBDSR (Moving Average Filter)have different roles. The usage distinctions are also described in the PDFs above.
Below, we introduce examples of signals from themBDSR (Moving Average Filter)on EUR/AUD across 1-hour, 30-minute, and 15-minute charts at nearly the same time.
EUR/AUD – 1-hour
Signals from mBDSR (two moving average filters)andGMMA
EUR/AUD – 30-minute
Signals from mBDSR (two moving average filters)andGMMA
EUR/AUD – 15-minute
Signals from mBDSR (two moving average filters)andGMMA
In the above examples, at each time frame,signals from mBDSR (two moving average filters)effectively capture a pullback buying timing.
Indicator with powerful performance when combined with RCI: 【BODSOR・mBDSR】
and methodology / case studies (PDF) ★GogoJungle AWARD2020 winner★
https://www.gogojungle.co.jp/tools/indicators/11836
The PDF files include 301 files (over 1,000 pages, over 350,000 characters in total).
Many of these describe how to logically link higher and lower timeframes using the three RCI lines to progressively analyze multiple lower timeframes and, ultimately, to prepare for a pullback buying or pullback selling timing on the lower timeframes (i.e., signals from mBDSR).
Also,there are many that emphasize identifying points where multiple entry premises overlap.
The explanation usesover 1,000 charts.
× ![]()


