

[Today's USD/JPY攻略] Capture the trend reversal and follow the trend — Role sharing of mBDSR (RCI2 two-filter and MA two-filter) — July 23, 2024
0
Indicator 【mBDSR】 that captures “tops/bottoms and reversals” in combination with RCI
and methods / case studies (PDF) ★GogoJungle AWARD 2020 winner★
https://www.gogojungle.co.jp/tools/indicators/11836
The above products include 301 PDF files (methods, case studies, etc.). For the list of titles of those PDFs, please refer to the article below.
About the 301 PDF files included with 【BODSOR・mBDSR】
https://www.gogojungle.co.jp/finance/navi/articles/34271
mBDSR (RCI filter)andmBDSR (Moving Average filter)serve different roles. The usage distinctions are also touched upon in the above PDFs.
Below,mBDSR (two RCI filters) andmBDSR (two MA filters)will be shown with example signals.
Dollar/Yen 15-minute chart
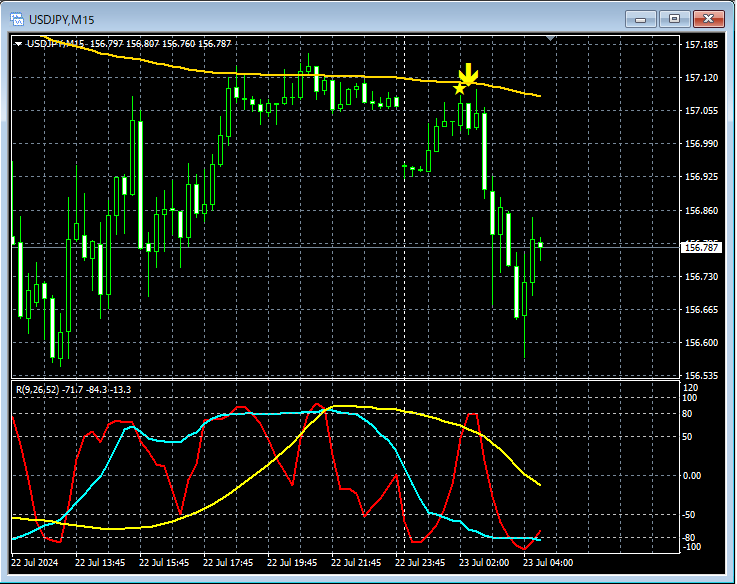
mBDSR (two RCI filters)signals
In the 15-minute chart above,the 15-minute EMA200could not be broken and a reversal occurred.mBDSR (two RCI filters) long-entry signallit up, accelerating the decline. It captures a downward reversal at the 15-minute level.
Dollar/Yen 5-minute chart
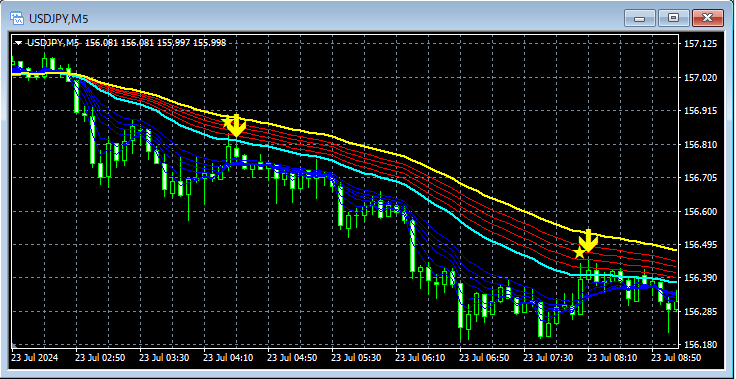
Signal for mBDSR (two MA filters)andGMMA
Here, we will continue from the above 15-minute chart and look at it on the 5-minute chart. In the 5-minute chart above, the timing of the resumption of the downward trend is well captured bythe signal of mBDSR (two MA filters).
An indicator that shines when combined with RCI: 【BODSOR・mBDSR】
and methods / case studies (PDF) ★GogoJungle AWARD 2020 winner★
https://www.gogojungle.co.jp/tools/indicators/11836
The PDF files include 301 items (over 1,000 pages in total, over 350,000 characters in total).
Most of them are examples that break down how to logically link upper and lower timeframes by using three RCI lines to examine multiple lower-timeframe conditions in order, ultimately waiting for a pullback or a reversal signal (i.e., an mBDSR signal) on the lower timeframes.In addition,
.
The explanations usein total.

and methods / case studies (PDF) ★GogoJungle AWARD 2020 winner★
https://www.gogojungle.co.jp/tools/indicators/11836
The above products include 301 PDF files (methods, case studies, etc.). For the list of titles of those PDFs, please refer to the article below.
About the 301 PDF files included with 【BODSOR・mBDSR】
https://www.gogojungle.co.jp/finance/navi/articles/34271
mBDSR (RCI filter)andmBDSR (Moving Average filter)serve different roles. The usage distinctions are also touched upon in the above PDFs.
Below,mBDSR (two RCI filters) andmBDSR (two MA filters)will be shown with example signals.
Dollar/Yen 15-minute chart
mBDSR (two RCI filters)signals
In the 15-minute chart above,the 15-minute EMA200could not be broken and a reversal occurred.mBDSR (two RCI filters) long-entry signallit up, accelerating the decline. It captures a downward reversal at the 15-minute level.
Dollar/Yen 5-minute chart
Signal for mBDSR (two MA filters)andGMMA
Here, we will continue from the above 15-minute chart and look at it on the 5-minute chart. In the 5-minute chart above, the timing of the resumption of the downward trend is well captured bythe signal of mBDSR (two MA filters).
An indicator that shines when combined with RCI: 【BODSOR・mBDSR】
and methods / case studies (PDF) ★GogoJungle AWARD 2020 winner★
https://www.gogojungle.co.jp/tools/indicators/11836
The PDF files include 301 items (over 1,000 pages in total, over 350,000 characters in total).
Most of them are examples that break down how to logically link upper and lower timeframes by using three RCI lines to examine multiple lower-timeframe conditions in order, ultimately waiting for a pullback or a reversal signal (i.e., an mBDSR signal) on the lower timeframes.In addition,
.
The explanations usein total.
× ![]()


