

【If you want to chase the trend...】Sign of mBDSR (Moving Average Filter) and GMMA from yesterday's chart (July 22, 2024)
0
Indicator that captures “tops and bottoms and reversal” in combination with RCI【mBDSR】
and methods / case studies (PDF) ★GogoJungle AWARD2020 winner★
https://www.gogojungle.co.jp/tools/indicators/11836
The above products include 301 PDFs (methods, case studies, etc.). For a list of the PDF titles, please see the article below.
About the 301 PDF files accompanying 【BODSOR・mBDSR】
https://www.gogojungle.co.jp/finance/navi/articles/34271
mBDSR (RCI filter)andmBDSR (Moving Average Filter)have different roles. The distinction between their uses is also touched upon in the PDFs above.
Below,mBDSR (Moving Average Filter)sign examples are introduced.
NZDUSD 1-hour chart
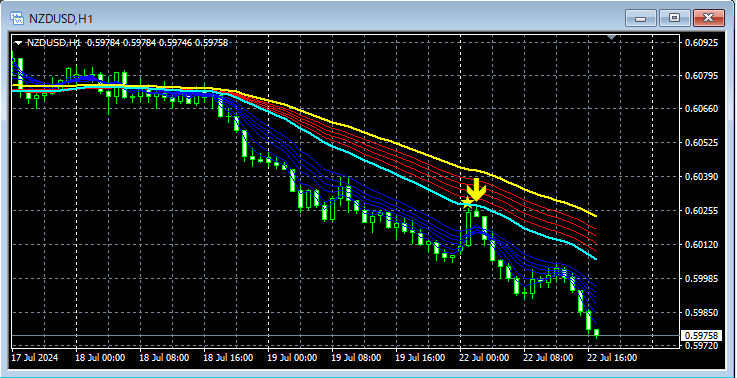
signs of the mBDSR (two moving average filters)andGMMA
EURNZD 1-hour chart
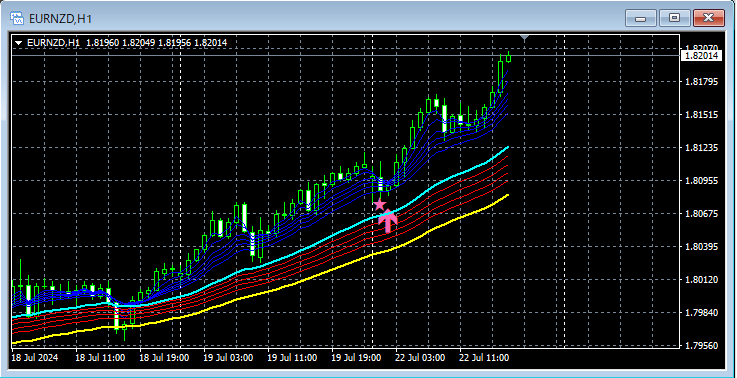
signs of the mBDSR (two moving average filters)andGMMA
GBPNZD 1-hour chart
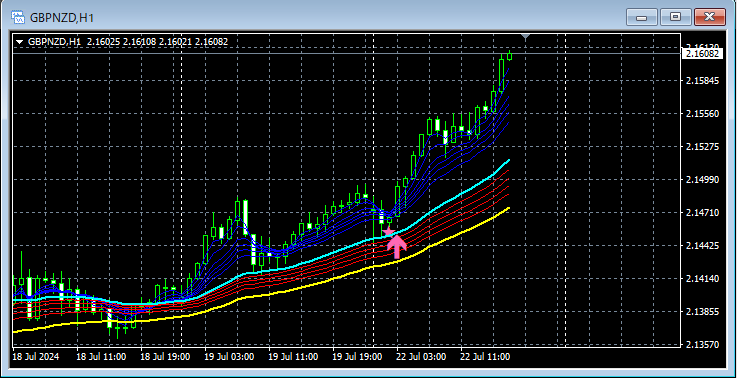
signs of the mBDSR (two moving average filters)andGMMA
NZDCAD 1-hour chart
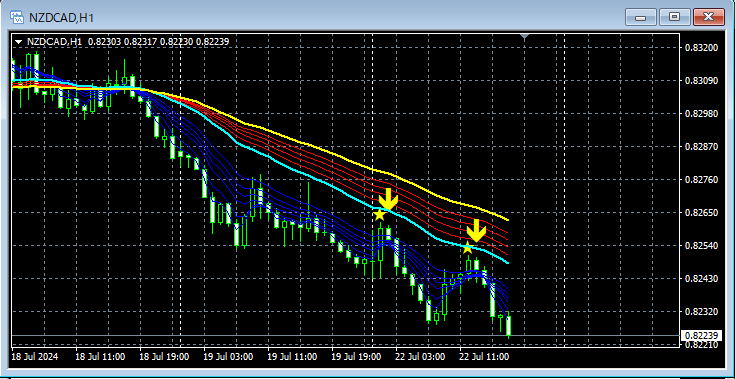
signs of the mBDSR (two moving average filters)andGMMA
NZDCHF 1-hour chart
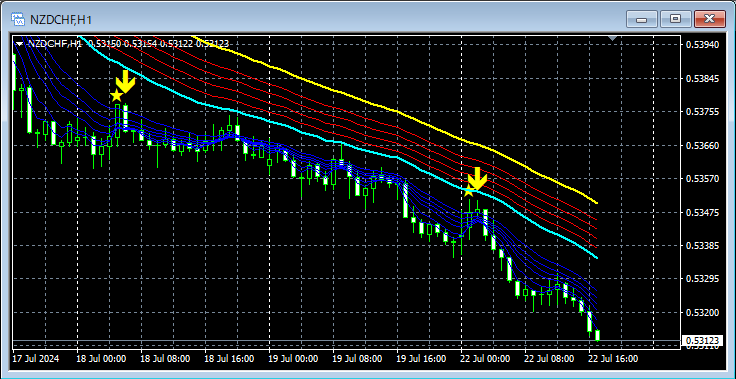
signs of the mBDSR (two moving average filters)andGMMA
Indicator that performs powerfully in combination with RCI【BODSOR・mBDSR】
and methods / case studies (PDF) ★GogoJungle AWARD2020 winner★
https://www.gogojungle.co.jp/tools/indicators/11836
The PDF files total 301 (over 1,000 pages, over 350,000 characters in total).
Most of them are structured to logically link higher and lower timeframes using three RCI lines, then sequentially consider multiple lower timeframes, ultimately waiting for lower timeframe pullback buying or pullback selling signals (i.e., mBDSR signals).They are arranged in this manner.
Additionally,many focus on capturing points where multiple entry rationales stack together.There are many such cases.
The explanations useover 1,000 chartsin total.

and methods / case studies (PDF) ★GogoJungle AWARD2020 winner★
https://www.gogojungle.co.jp/tools/indicators/11836
The above products include 301 PDFs (methods, case studies, etc.). For a list of the PDF titles, please see the article below.
About the 301 PDF files accompanying 【BODSOR・mBDSR】
https://www.gogojungle.co.jp/finance/navi/articles/34271
mBDSR (RCI filter)andmBDSR (Moving Average Filter)have different roles. The distinction between their uses is also touched upon in the PDFs above.
Below,mBDSR (Moving Average Filter)sign examples are introduced.
NZDUSD 1-hour chart
signs of the mBDSR (two moving average filters)andGMMA
EURNZD 1-hour chart
signs of the mBDSR (two moving average filters)andGMMA
GBPNZD 1-hour chart
signs of the mBDSR (two moving average filters)andGMMA
NZDCAD 1-hour chart
signs of the mBDSR (two moving average filters)andGMMA
NZDCHF 1-hour chart
signs of the mBDSR (two moving average filters)andGMMA
Indicator that performs powerfully in combination with RCI【BODSOR・mBDSR】
and methods / case studies (PDF) ★GogoJungle AWARD2020 winner★
https://www.gogojungle.co.jp/tools/indicators/11836
The PDF files total 301 (over 1,000 pages, over 350,000 characters in total).
Most of them are structured to logically link higher and lower timeframes using three RCI lines, then sequentially consider multiple lower timeframes, ultimately waiting for lower timeframe pullback buying or pullback selling signals (i.e., mBDSR signals).They are arranged in this manner.
Additionally,many focus on capturing points where multiple entry rationales stack together.There are many such cases.
The explanations useover 1,000 chartsin total.
× ![]()


