

Two-line RCI and Elliott Wave and double bottom and neck line and moving average and counter-trend line and mBDSR (RCI two-line filter) buy signal
An indicator that captures "tops and bottoms and reversals" in combination with RCI【mBDSR】
Methods and Case Studies (PDF) ★GogoJungle AWARD2020 Winner★
https://www.gogojungle.co.jp/tools/indicators/11836
The above product includes 301 PDFs (methods, case studies, etc.). For a list of the titles of those PDFs, please refer to the article below.
About the 301 PDF files included with 【BODSOR・mBDSR】
https://www.gogojungle.co.jp/finance/navi/articles/34271
EUR/CAD 1-hour chart
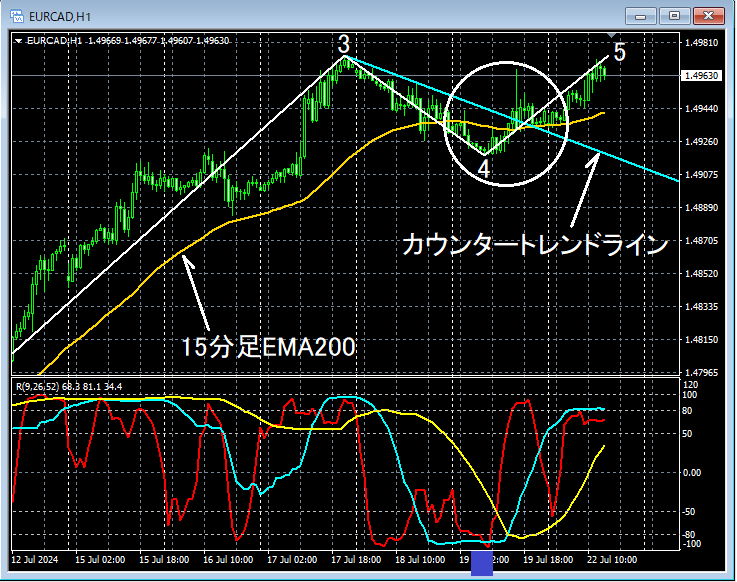
On the above 1-hour chart, the lower timeframe of 15 minutesElliott Waveis displayed.Wave 3 of the ascentis considered to be followed by a decline, and the so-calleddouble bottom with RCI2(blue square) has dropped to that level, suggesting a potential sizable rebound. If it moves upward from hereWave 5may be starting. We will examine around the white circled area on the lower time frame (15 minutes) in detail.
EUR/CAD 15-minute chart
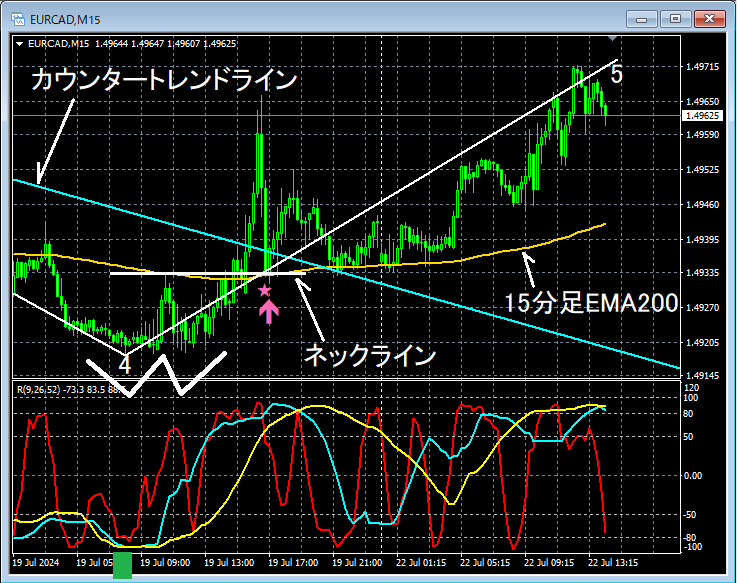
On the above 15-minute chart, the so-calledRCI3-bottom(green square) has dropped to that level, forming a shape that could see a sizable rebound. If it moves upward from hereWave 5may be starting. Looking at the chart, adouble bottomis forming and it has surpassedEMA200counter-trend line,the neckline of the double bottomandEMA200are converging, at which pointthe mBDSR (two RCI lines) pullback buy signallights up, and the price then rises again.
From this example,Elliott Waveandthree RCI lines, Elliott Wave, double bottom, neckline, and moving averages as trading signalsandthe mBDSR signalsshow strong compatibility.
An indicator that delivers power in combination with RCI【BODSOR・mBDSR】
Methods and Case Studies (PDF) ★GogoJungle AWARD2020 Winner★
https://www.gogojungle.co.jp/tools/indicators/11836
The PDF files included amount to 301 files (over 1,000 pages, over 350,000 characters in total).
Many of them are aboutusing three RCI lines to logically link higher and lower timeframes, systematically assessing the conditions of multiple lower timeframes, and ultimately waiting for pullbacks (or reversals) on the lower timeframes as signals of mBDSR.
In addition,many of them focus on identifying points where multiple entry reasons overlap.
The explanations usemore than 1,000 charts.

Methods and Case Studies (PDF) ★GogoJungle AWARD2020 Winner★
https://www.gogojungle.co.jp/tools/indicators/11836
The above product includes 301 PDFs (methods, case studies, etc.). For a list of the titles of those PDFs, please refer to the article below.
About the 301 PDF files included with 【BODSOR・mBDSR】
https://www.gogojungle.co.jp/finance/navi/articles/34271
EUR/CAD 1-hour chart
On the above 1-hour chart, the lower timeframe of 15 minutesElliott Waveis displayed.Wave 3 of the ascentis considered to be followed by a decline, and the so-calleddouble bottom with RCI2(blue square) has dropped to that level, suggesting a potential sizable rebound. If it moves upward from hereWave 5may be starting. We will examine around the white circled area on the lower time frame (15 minutes) in detail.
EUR/CAD 15-minute chart
On the above 15-minute chart, the so-calledRCI3-bottom(green square) has dropped to that level, forming a shape that could see a sizable rebound. If it moves upward from hereWave 5may be starting. Looking at the chart, adouble bottomis forming and it has surpassedEMA200counter-trend line,the neckline of the double bottomandEMA200are converging, at which pointthe mBDSR (two RCI lines) pullback buy signallights up, and the price then rises again.
From this example,Elliott Waveandthree RCI lines, Elliott Wave, double bottom, neckline, and moving averages as trading signalsandthe mBDSR signalsshow strong compatibility.
An indicator that delivers power in combination with RCI【BODSOR・mBDSR】
Methods and Case Studies (PDF) ★GogoJungle AWARD2020 Winner★
https://www.gogojungle.co.jp/tools/indicators/11836
The PDF files included amount to 301 files (over 1,000 pages, over 350,000 characters in total).
Many of them are aboutusing three RCI lines to logically link higher and lower timeframes, systematically assessing the conditions of multiple lower timeframes, and ultimately waiting for pullbacks (or reversals) on the lower timeframes as signals of mBDSR.
In addition,many of them focus on identifying points where multiple entry reasons overlap.
The explanations usemore than 1,000 charts.
× ![]()


