

Downward trendline in the upper leg and short-selling signal from mBDSR (RCI two-filter)
Indicator that captures “bottom/top reversal” when combined with RCI: 【mBDSR】
Methods and Case Studies (PDF) ★GogoJungle AWARD2020 Winner★
https://www.gogojungle.co.jp/tools/indicators/11836
The above products include 301 PDFs (methods, case studies, etc.). For a list of the PDF titles, please see the article below.
About the 301 PDF files included with 【BODSOR・mBDSR】
https://www.gogojungle.co.jp/finance/navi/articles/34271
GBP/JPY – 1 hour chart
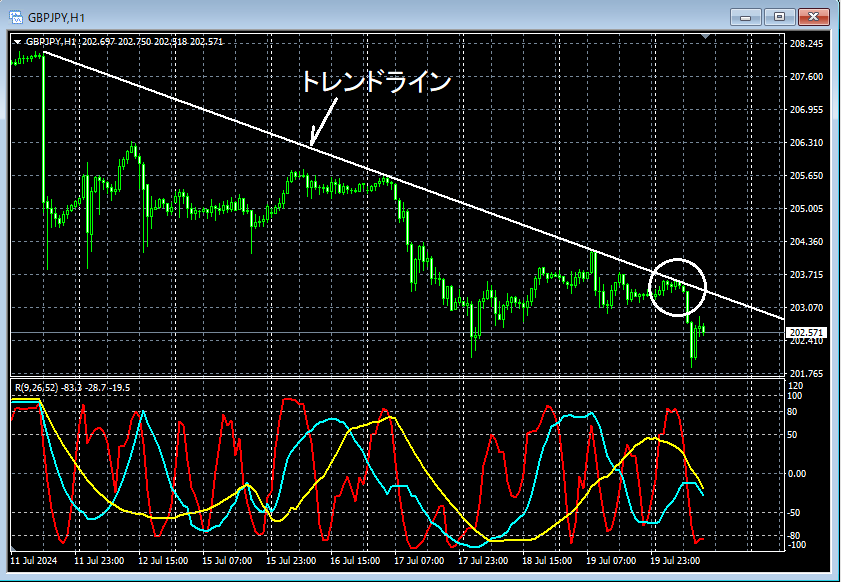
If you look at the area circled in white on the above hourly chart,a downtrend linehas risen toward the nearby area, and it may not be strange to think about selling on a retracement on the lower time frame. We will look for signs of a reversal on the lower time frame.
GBP/JPY – 5 minutes
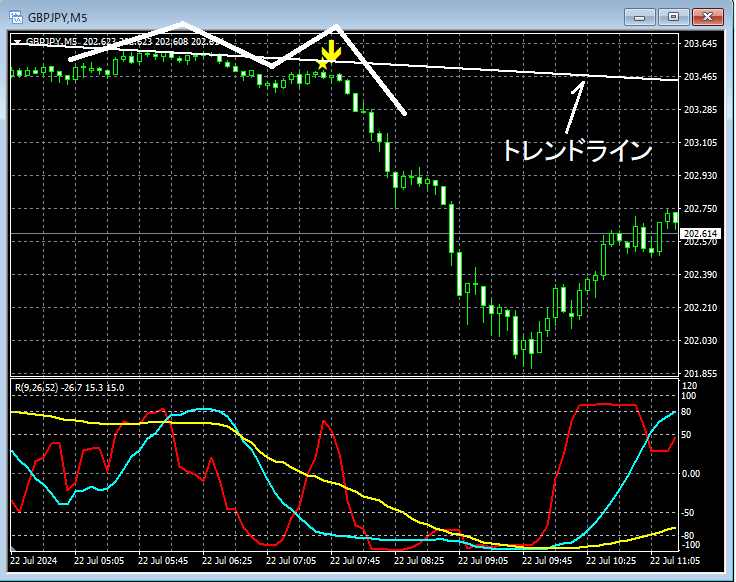
On the 5-minute chart above,the retracement sell signal from mBDSR (filters: RCI26 and RCI52)appears near thedowntrend line of the higher time frameand subsequently the price declines smoothly. This retracement sell signal isformed near thedowntrend line of the higher time framethe right peak of a double toptiming the start of the decline well.
From this example,a trading approach that focuses on the downtrend line and double top of the higher time frameandthe signals of mBDSRappear to have strong compatibility.
Also in this example, placing the stop loss atthe left peak of the double top (recent high)allows fora favorable risk-reward trade.
Indicator that shines when combined with RCI: 【BODSOR・mBDSR】
Methods and Case Studies (PDF) ★GogoJungle AWARD2020 Winner★
https://www.gogojungle.co.jp/tools/indicators/11836
The PDF files include 301 PDFs (more than 1,000 pages, over 350,000 characters in total).
Most of them aresummaries of how logically linking higher and lower time frames using three RCI lines leads to analyzing multiple lower time frames step by step, ultimately waiting for entry timing (mBDSR signals) on the lower time frame for a buyable dip or a retracement.
In addition,there are many that emphasize identifying points where multiple entry reasons coincide.
The description usesmore than 1,000 charts.

Methods and Case Studies (PDF) ★GogoJungle AWARD2020 Winner★
https://www.gogojungle.co.jp/tools/indicators/11836
The above products include 301 PDFs (methods, case studies, etc.). For a list of the PDF titles, please see the article below.
About the 301 PDF files included with 【BODSOR・mBDSR】
https://www.gogojungle.co.jp/finance/navi/articles/34271
GBP/JPY – 1 hour chart
If you look at the area circled in white on the above hourly chart,a downtrend linehas risen toward the nearby area, and it may not be strange to think about selling on a retracement on the lower time frame. We will look for signs of a reversal on the lower time frame.
GBP/JPY – 5 minutes
On the 5-minute chart above,the retracement sell signal from mBDSR (filters: RCI26 and RCI52)appears near thedowntrend line of the higher time frameand subsequently the price declines smoothly. This retracement sell signal isformed near thedowntrend line of the higher time framethe right peak of a double toptiming the start of the decline well.
From this example,a trading approach that focuses on the downtrend line and double top of the higher time frameandthe signals of mBDSRappear to have strong compatibility.
Also in this example, placing the stop loss atthe left peak of the double top (recent high)allows fora favorable risk-reward trade.
Indicator that shines when combined with RCI: 【BODSOR・mBDSR】
Methods and Case Studies (PDF) ★GogoJungle AWARD2020 Winner★
https://www.gogojungle.co.jp/tools/indicators/11836
The PDF files include 301 PDFs (more than 1,000 pages, over 350,000 characters in total).
Most of them aresummaries of how logically linking higher and lower time frames using three RCI lines leads to analyzing multiple lower time frames step by step, ultimately waiting for entry timing (mBDSR signals) on the lower time frame for a buyable dip or a retracement.
In addition,there are many that emphasize identifying points where multiple entry reasons coincide.
The description usesmore than 1,000 charts.
× ![]()


