

【mBDSR (RCI2 本フィルター) の活用例】3回目の移動平均線上抜けトライ
Indicator that captures the bottom, reversal with the combination of RCI – 【mBDSR】
Method and Case Study (PDF) ★GogoJungle AWARD2020 Winner★
https://www.gogojungle.co.jp/tools/indicators/11836
The above product includes 301 PDFs (methods, case studies, etc.). For a list of the PDF titles, please refer to the article below.
Regarding the 301 PDF files included with 【BODSOR・mBDSR】
https://www.gogojungle.co.jp/finance/navi/articles/34271
EUR/JPY 1-hour chart
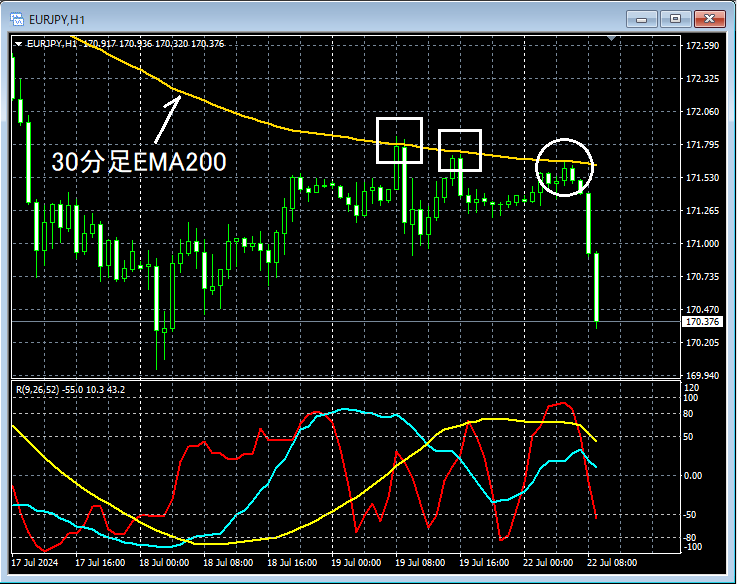
If you look at the area circled in white on the 1-hour chart above, it has previously functioned as resistancenear the 30-minute EMA200Having risen again toward the vicinity.A third breakout attemptcould be considered. Therefore, unless this moving average is clearly broken above, there is a possibility of a sharp decline, and it may not be strange to look for selling opportunities on lower timeframes. Thisnear the 30-minute EMA200we should look for signs of reversal on lower timeframes.
Using the method in the included PDFs, we apply RCI to progressively drop from higher timeframes (1-hour) to lower timeframes, and in this example, eventually bring it to a form that waits for a signal on the 5-minute chart. The process is not described here (it is not simply looking at the 5-minute chart after the 1-hour).
EUR/JPY 5-minute chart
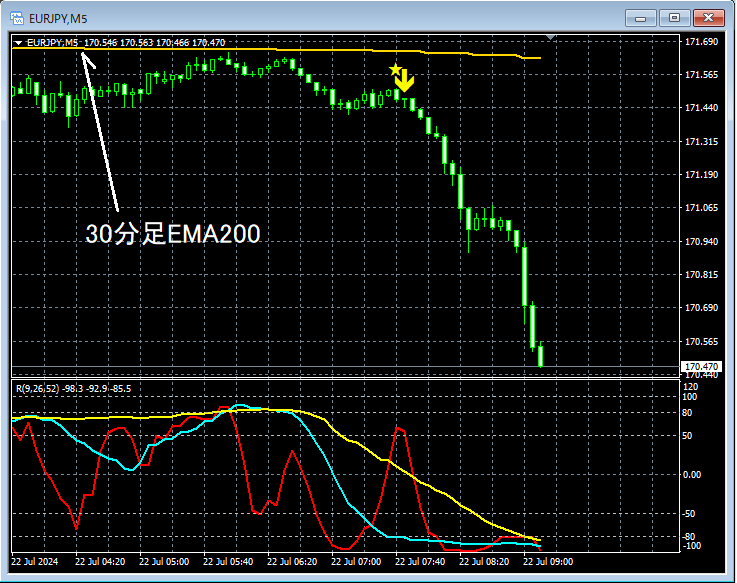
Looking at the 5-minute chart above,near the 30-minute EMA200reversal appears to be developing. AndmBDSR (Filter: RCI26 and RCI52) buyback signallights up and the price drops significantly.
From this example,a trading method focused on reversals at moving averages (possibility of third failed breakout)andthe synergy with the mBDSR signalare evident.
Also in this example, placing the stop loss just above the recent highcan yield a favorable risk-reward tradeby doing so.
Indicator that shines when combined with RCI: 【BODSOR・mBDSR】
Method and Case Study (PDF) ★GogoJungle AWARD2020 Winner★
https://www.gogojungle.co.jp/tools/indicators/11836
The PDF files include 301 files (over 1,000 pages in total, over 350,000 characters).
Many of them aresummaries of how to logically link higher and lower timeframes using the RCI three-line setup, examining multiple lower timeframes in sequence, and ultimately waiting for a buying point on lower timeframes (i.e., the mBDSR signal)as an example.
Additionally,many focus on identifying scenarios where multiple entry reasons convergeas well.
In the explanations,more than 1,000 chartsare used.

Method and Case Study (PDF) ★GogoJungle AWARD2020 Winner★
https://www.gogojungle.co.jp/tools/indicators/11836
The above product includes 301 PDFs (methods, case studies, etc.). For a list of the PDF titles, please refer to the article below.
Regarding the 301 PDF files included with 【BODSOR・mBDSR】
https://www.gogojungle.co.jp/finance/navi/articles/34271
EUR/JPY 1-hour chart
If you look at the area circled in white on the 1-hour chart above, it has previously functioned as resistancenear the 30-minute EMA200Having risen again toward the vicinity.A third breakout attemptcould be considered. Therefore, unless this moving average is clearly broken above, there is a possibility of a sharp decline, and it may not be strange to look for selling opportunities on lower timeframes. Thisnear the 30-minute EMA200we should look for signs of reversal on lower timeframes.
Using the method in the included PDFs, we apply RCI to progressively drop from higher timeframes (1-hour) to lower timeframes, and in this example, eventually bring it to a form that waits for a signal on the 5-minute chart. The process is not described here (it is not simply looking at the 5-minute chart after the 1-hour).
EUR/JPY 5-minute chart
Looking at the 5-minute chart above,near the 30-minute EMA200reversal appears to be developing. AndmBDSR (Filter: RCI26 and RCI52) buyback signallights up and the price drops significantly.
From this example,a trading method focused on reversals at moving averages (possibility of third failed breakout)andthe synergy with the mBDSR signalare evident.
Also in this example, placing the stop loss just above the recent highcan yield a favorable risk-reward tradeby doing so.
Indicator that shines when combined with RCI: 【BODSOR・mBDSR】
Method and Case Study (PDF) ★GogoJungle AWARD2020 Winner★
https://www.gogojungle.co.jp/tools/indicators/11836
The PDF files include 301 files (over 1,000 pages in total, over 350,000 characters).
Many of them aresummaries of how to logically link higher and lower timeframes using the RCI three-line setup, examining multiple lower timeframes in sequence, and ultimately waiting for a buying point on lower timeframes (i.e., the mBDSR signal)as an example.
Additionally,many focus on identifying scenarios where multiple entry reasons convergeas well.
In the explanations,more than 1,000 chartsare used.
× ![]()


