

Look for signs of a pullback near the moving averages we monitor closely [Using mBDSR (RCI two-filter) example] from the recent EUR/JPY chart
0
Indicator that captures “top and bottom turning points” in combination with RCI: 【mBDSR】
Method and case studies (PDF) ★GogoJungle AWARD2020 winner★
https://www.gogojungle.co.jp/tools/indicators/11836
The above product includes 301 PDFs (methods, case studies, etc.). For a list of the titles of those PDFs, please refer to the article below.
About the 301 PDF files included with 【BODSOR・mBDSR】
https://www.gogojungle.co.jp/finance/navi/articles/34271
EUR/JPY 4-hour
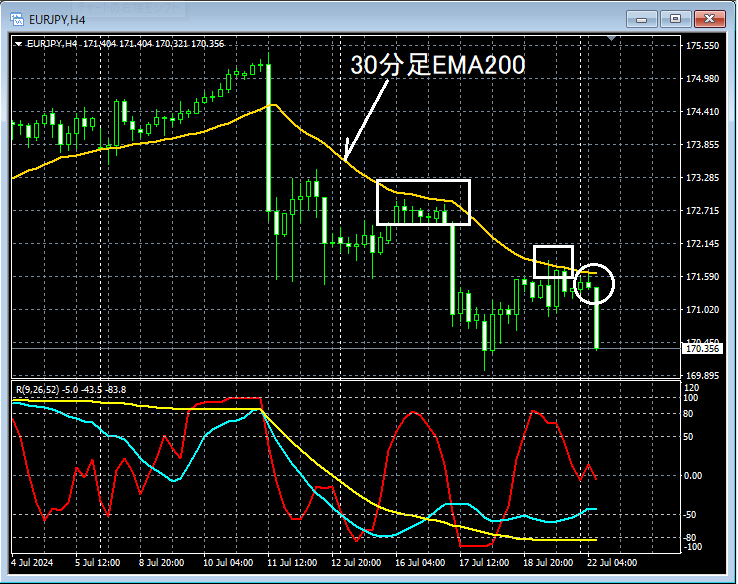
If you look at the area circled in white on the 4-hour chart above, it has historically functioned as resistance30-minute EMA200It has risen again toward this vicinity, and until the moving average is clearly broken above, it may not be unreasonable to look for sell-on-rallies on lower timeframes. The moving average that is considered important (in this case30-minute EMA200) should be checked on the lower timeframe for any signs of reversal.
Using the method in the accompanying PDFs, using RCI to progressively drop from higher time frames (4-hour) to lower ones, in this example, it is possible to end up waiting for a signal on the 5-minute chart; however, the process is not omitted. (It is not because I arbitrarily started looking at the 5-minute chart after the 4-hour.)
EUR/JPY 5-minute
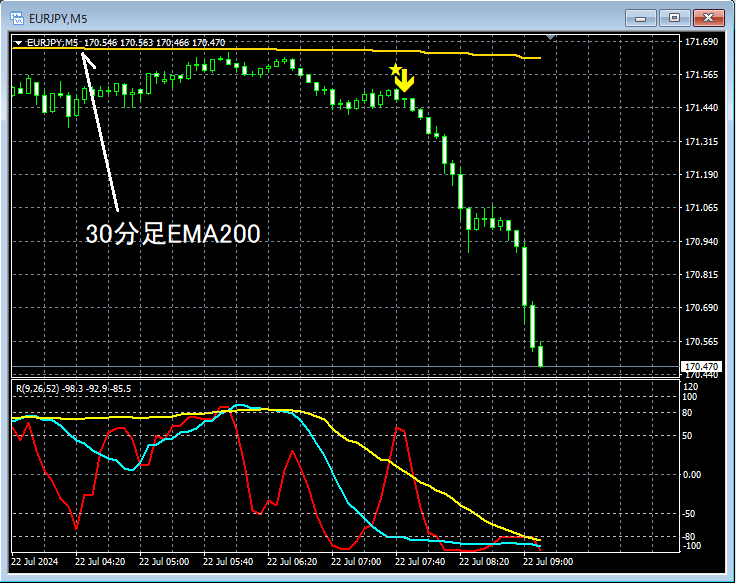
Looking at the above 5-minute chart30-minute EMA200Shows signs of reversal. AndmBDSR (Filter: RCI26 and RCI52) sell signalhas lit up and the price has dropped sharply.
From this example,a trading method focused on reversals around moving averagesandthe signal of mBDSRshow a high degree of compatibility.
Also, in this example, placing the stop-loss slightly above the most recent highandyou can achieve a favorable risk-reward trade.
Indicator that shines when combined with RCI: 【BODSOR・mBDSR】
Method and case studies (PDF) ★GogoJungle AWARD2020 winner★
https://www.gogojungle.co.jp/tools/indicators/11836
The PDF files amount to 301 (over 1,000 pages, over 350,000 characters in total).
Many of them are of the form that link the higher and lower time frames logically using three RCI lines, progressively analyzing multiple lower time frames, and ultimately waiting for an entry timing on the lower time frame (i.e., a mBDSR signal) such that the analysis leads to a trade opportunity.In addition,
many of them focus on capturing points where multiple entry reasons overlap.There are many such examples.
The explanations usemore than 1,000 chartsin total.

Method and case studies (PDF) ★GogoJungle AWARD2020 winner★
https://www.gogojungle.co.jp/tools/indicators/11836
The above product includes 301 PDFs (methods, case studies, etc.). For a list of the titles of those PDFs, please refer to the article below.
About the 301 PDF files included with 【BODSOR・mBDSR】
https://www.gogojungle.co.jp/finance/navi/articles/34271
EUR/JPY 4-hour
If you look at the area circled in white on the 4-hour chart above, it has historically functioned as resistance30-minute EMA200It has risen again toward this vicinity, and until the moving average is clearly broken above, it may not be unreasonable to look for sell-on-rallies on lower timeframes. The moving average that is considered important (in this case30-minute EMA200) should be checked on the lower timeframe for any signs of reversal.
Using the method in the accompanying PDFs, using RCI to progressively drop from higher time frames (4-hour) to lower ones, in this example, it is possible to end up waiting for a signal on the 5-minute chart; however, the process is not omitted. (It is not because I arbitrarily started looking at the 5-minute chart after the 4-hour.)
EUR/JPY 5-minute
Looking at the above 5-minute chart30-minute EMA200Shows signs of reversal. AndmBDSR (Filter: RCI26 and RCI52) sell signalhas lit up and the price has dropped sharply.
From this example,a trading method focused on reversals around moving averagesandthe signal of mBDSRshow a high degree of compatibility.
Also, in this example, placing the stop-loss slightly above the most recent highandyou can achieve a favorable risk-reward trade.
Indicator that shines when combined with RCI: 【BODSOR・mBDSR】
Method and case studies (PDF) ★GogoJungle AWARD2020 winner★
https://www.gogojungle.co.jp/tools/indicators/11836
The PDF files amount to 301 (over 1,000 pages, over 350,000 characters in total).
Many of them are of the form that link the higher and lower time frames logically using three RCI lines, progressively analyzing multiple lower time frames, and ultimately waiting for an entry timing on the lower time frame (i.e., a mBDSR signal) such that the analysis leads to a trade opportunity.In addition,
many of them focus on capturing points where multiple entry reasons overlap.There are many such examples.
The explanations usemore than 1,000 chartsin total.
× ![]()


