

Moving Average Golden Cross and mBDSR (RCI 2-line filter) Buy-the-Dip Signal
0
Indicator that captures “top and bottom reversal” when combined with RCI: 【mBDSR】
Methods and Case Studies (PDF) ★GogoJungle AWARD2020 Winner★
https://www.gogojungle.co.jp/tools/indicators/11836
The above products include 301 PDFs (methods, case studies, etc.). For a list of the titles of those PDFs, please refer to the article below.
About the 301 PDF files included with 【BODSOR・mBDSR】
https://www.gogojungle.co.jp/finance/navi/articles/34271
AUDNZD 1-hour
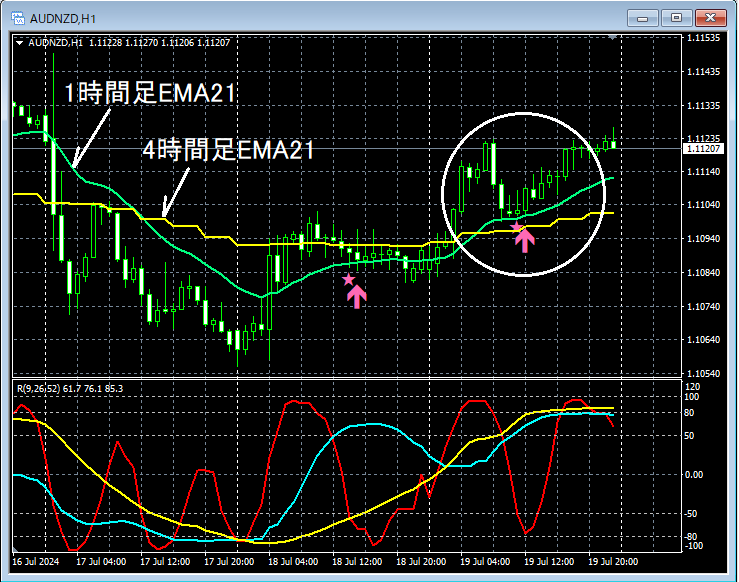
In the 1-hour chart above,mBDSR (Filter: RCI26 and RCI52)The first pullback buy signal has lit up twice, but here we will focus on the second signal.
The second pullback buy signal isafter breaking above the 4-hour EMA21andthe 1-hour EMA21then pulling back around the 1-hour EMA21, lighting up around that area and catching the moment to resume the uptrend well. At that time,the 4-hour EMA21andthe 1-hour EMA21aregolden crossto note.From this example,a trading method focused on the golden cross of moving averagesandthe signals of mBDSRshow strong compatibility.Indicator that shines in combination with RCI: 【BODSOR・mBDSR】Methods and Case Studies (PDF) ★GogoJungle AWARD2020 Winner★https://www.gogojungle.co.jp/tools/indicators/11836PDF files included: 301 files.Many of these relate to logically linking higher and lower timeframes using three RCI lines to examine multiple lower timeframe conditions sequentially, and ultimately to wait for pullback buy or pullback sell timing (i.e., mBDSR signals) on the lower timeframeas an example of what was condensed.Additionally,many emphasize identifying points where multiple entry reasons overlap.There are many such cases.The explanations usemore than 1,000 chartsin total.the 4-hour EMA21andthe 1-hour EMA21aregolden cross
From this example,a trading method focused on the golden cross of moving averagesandthe signals of mBDSRshow strong compatibility.
Indicator that shines in combination with RCI: 【BODSOR・mBDSR】
Methods and Case Studies (PDF) ★GogoJungle AWARD2020 Winner★
https://www.gogojungle.co.jp/tools/indicators/11836
PDF files included: 301 files.
Many of these relate to logically linking higher and lower timeframes using three RCI lines to examine multiple lower timeframe conditions sequentially, and ultimately to wait for pullback buy or pullback sell timing (i.e., mBDSR signals) on the lower timeframeas an example of what was condensed.
Additionally,many emphasize identifying points where multiple entry reasons overlap.There are many such cases.
The explanations usemore than 1,000 chartsin total.

Methods and Case Studies (PDF) ★GogoJungle AWARD2020 Winner★
https://www.gogojungle.co.jp/tools/indicators/11836
The above products include 301 PDFs (methods, case studies, etc.). For a list of the titles of those PDFs, please refer to the article below.
About the 301 PDF files included with 【BODSOR・mBDSR】
https://www.gogojungle.co.jp/finance/navi/articles/34271
AUDNZD 1-hour
In the 1-hour chart above,mBDSR (Filter: RCI26 and RCI52)The first pullback buy signal has lit up twice, but here we will focus on the second signal.
The second pullback buy signal isafter breaking above the 4-hour EMA21andthe 1-hour EMA21then pulling back around the 1-hour EMA21, lighting up around that area and catching the moment to resume the uptrend well. At that time,the 4-hour EMA21andthe 1-hour EMA21aregolden crossto note.From this example,a trading method focused on the golden cross of moving averagesandthe signals of mBDSRshow strong compatibility.Indicator that shines in combination with RCI: 【BODSOR・mBDSR】Methods and Case Studies (PDF) ★GogoJungle AWARD2020 Winner★https://www.gogojungle.co.jp/tools/indicators/11836PDF files included: 301 files.Many of these relate to logically linking higher and lower timeframes using three RCI lines to examine multiple lower timeframe conditions sequentially, and ultimately to wait for pullback buy or pullback sell timing (i.e., mBDSR signals) on the lower timeframeas an example of what was condensed.Additionally,many emphasize identifying points where multiple entry reasons overlap.There are many such cases.The explanations usemore than 1,000 chartsin total.the 4-hour EMA21andthe 1-hour EMA21aregolden cross
From this example,a trading method focused on the golden cross of moving averagesandthe signals of mBDSRshow strong compatibility.
Indicator that shines in combination with RCI: 【BODSOR・mBDSR】
Methods and Case Studies (PDF) ★GogoJungle AWARD2020 Winner★
https://www.gogojungle.co.jp/tools/indicators/11836
PDF files included: 301 files.
Many of these relate to logically linking higher and lower timeframes using three RCI lines to examine multiple lower timeframe conditions sequentially, and ultimately to wait for pullback buy or pullback sell timing (i.e., mBDSR signals) on the lower timeframeas an example of what was condensed.
Additionally,many emphasize identifying points where multiple entry reasons overlap.There are many such cases.
The explanations usemore than 1,000 chartsin total.
× ![]()


