

[Build on multiple bases] Buy signal on pullback with previous low, pin bar, 2B reversal, double bottom, and mBDSR (RCI2 main filters).
Indicator “Capture Tops and Bottoms, Reversal” combined with RCI: [mBDSR]
Methods & Case Studies (PDF) ★GogoJungle AWARD2020 Winner★
https://www.gogojungle.co.jp/tools/indicators/11836
The above products include 301 PDFs. For a list of those PDF titles, please see the article below.
About the 301 PDF files included with 【BODSOR・mBDSR】
https://www.gogojungle.co.jp/finance/navi/articles/34271
Dollar/Swiss Franc Daily Chart
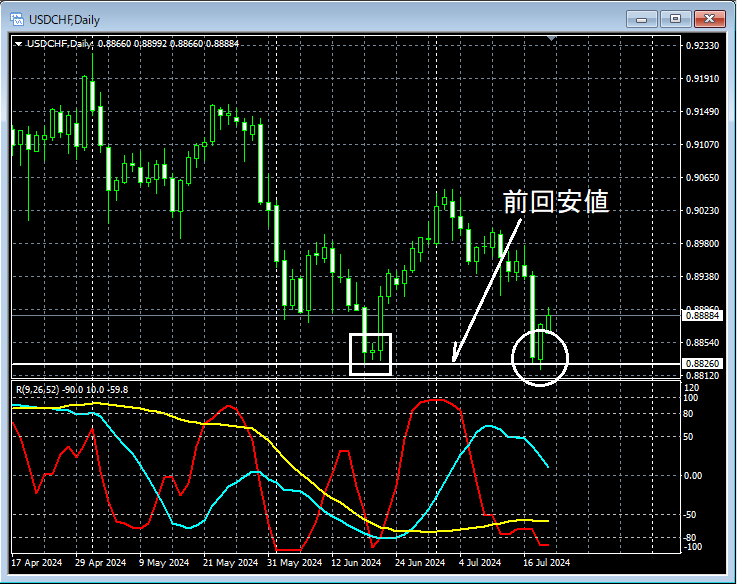
Looking at the area circled in white on the daily chart above,the previous lowhas been undershot to near that level, and it isn’t unreasonable to expect a brief rise. We will look for signs of an upmove on lower timeframes.
Dollar/Swiss Franc 4-hour
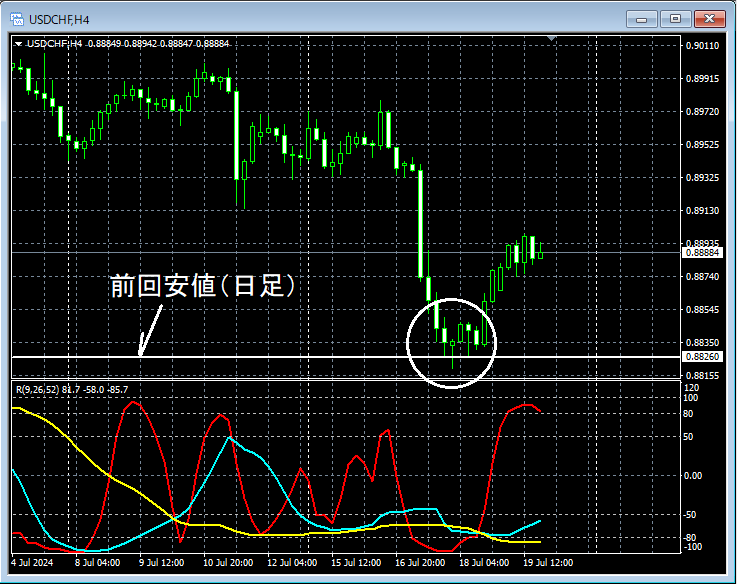
When you look at the area circled in white on the 4-hour chart above,the previous daily lowoverlaps the area, and after a drop to near that level, signals of an upmove appearPin Bar (long lower shadow)is visible. It may be reasonable to consider a buying dip on the lower timeframes.
Dollar/Swiss Franc 1-hour
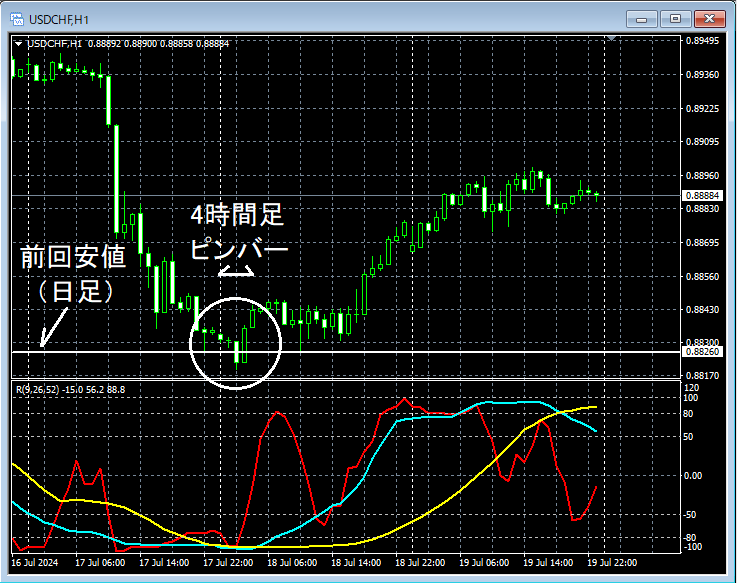
Looking at the area circled in white on the 1-hour chart above, on the 4-hour chartPin Barappears, and near this area, theTwo-Bar Reversal (2B Reversal)appears, indicating a potential rise. It may be reasonable to consider buying the dip on the lower timeframes.
Dollar/Swiss Franc 30-minute
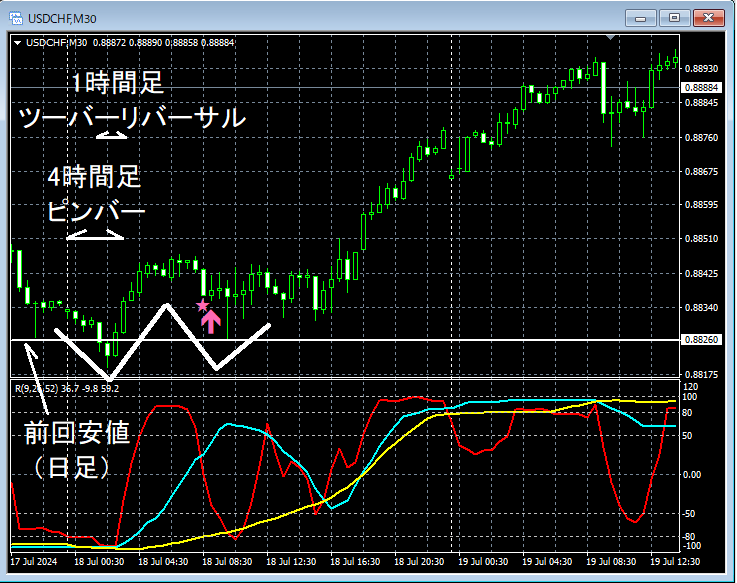
If you look at the 5-minute chart above, on the 4-hour chartPin Barappears, and on the 1-hour chartTwo-Barrier Reversal (2B Reversal)appears and retreats,mBDSR (Filter: RCI26 and RCI52) Buy-the-Dip signallights up. As a result,the right-side valley of the double bottomshows a buy-the-dip signal.
From this example,a trading method focusing on the previous low, pin bars, 2B reversals, and double bottomsand thesignals of mBDSRappear to have a strong synergy.
Additionally, in this example, placing the stop loss slightly below the left-side valley of the double bottom (near the latest low)allows for favorable risk-reward tradingopportunities.
Indicator that shines when combined with RCI: 【BODSOR・mBDSR】
Methods & Case Studies (PDF) ★GogoJungle AWARD2020 Winner★
https://www.gogojungle.co.jp/tools/indicators/11836
260 PDF files are included.Many of them are arranged to examine multiple lower timeframes logically by linking the higher and lower timeframes using the three RCI lines, ultimately waiting for dips or retests timings (i.e., mBDSR signals) on the lower timeframes. The explanations useover 1,000 chartsas reference.

Methods & Case Studies (PDF) ★GogoJungle AWARD2020 Winner★
https://www.gogojungle.co.jp/tools/indicators/11836
The above products include 301 PDFs. For a list of those PDF titles, please see the article below.
About the 301 PDF files included with 【BODSOR・mBDSR】
https://www.gogojungle.co.jp/finance/navi/articles/34271
Dollar/Swiss Franc Daily Chart
Looking at the area circled in white on the daily chart above,the previous lowhas been undershot to near that level, and it isn’t unreasonable to expect a brief rise. We will look for signs of an upmove on lower timeframes.
Dollar/Swiss Franc 4-hour
When you look at the area circled in white on the 4-hour chart above,the previous daily lowoverlaps the area, and after a drop to near that level, signals of an upmove appearPin Bar (long lower shadow)is visible. It may be reasonable to consider a buying dip on the lower timeframes.
Dollar/Swiss Franc 1-hour
Looking at the area circled in white on the 1-hour chart above, on the 4-hour chartPin Barappears, and near this area, theTwo-Bar Reversal (2B Reversal)appears, indicating a potential rise. It may be reasonable to consider buying the dip on the lower timeframes.
Dollar/Swiss Franc 30-minute
If you look at the 5-minute chart above, on the 4-hour chartPin Barappears, and on the 1-hour chartTwo-Barrier Reversal (2B Reversal)appears and retreats,mBDSR (Filter: RCI26 and RCI52) Buy-the-Dip signallights up. As a result,the right-side valley of the double bottomshows a buy-the-dip signal.
From this example,a trading method focusing on the previous low, pin bars, 2B reversals, and double bottomsand thesignals of mBDSRappear to have a strong synergy.
Additionally, in this example, placing the stop loss slightly below the left-side valley of the double bottom (near the latest low)allows for favorable risk-reward tradingopportunities.
Indicator that shines when combined with RCI: 【BODSOR・mBDSR】
Methods & Case Studies (PDF) ★GogoJungle AWARD2020 Winner★
https://www.gogojungle.co.jp/tools/indicators/11836
260 PDF files are included.Many of them are arranged to examine multiple lower timeframes logically by linking the higher and lower timeframes using the three RCI lines, ultimately waiting for dips or retests timings (i.e., mBDSR signals) on the lower timeframes. The explanations useover 1,000 chartsas reference.
× ![]()


