

Moving Average Line, Double Bottom, Countertrend Line, and mBDSR (RCI two-line filter) Buy Signal on Pullback (2)
Indicator that captures the bottom and reversal in conjunction with RCI: 【mBDSR】
Methods and Case Study (PDF) ★GogoJungle AWARD2020 winner★
https://www.gogojungle.co.jp/tools/indicators/11836
The above product includes 301 PDFs. For a list of the PDF titles and related details, please see the article below.
About the 301 PDF files included with 【BODSOR・mBDSR】
https://www.gogojungle.co.jp/finance/navi/articles/34271
Pound AUD 4-hour chart
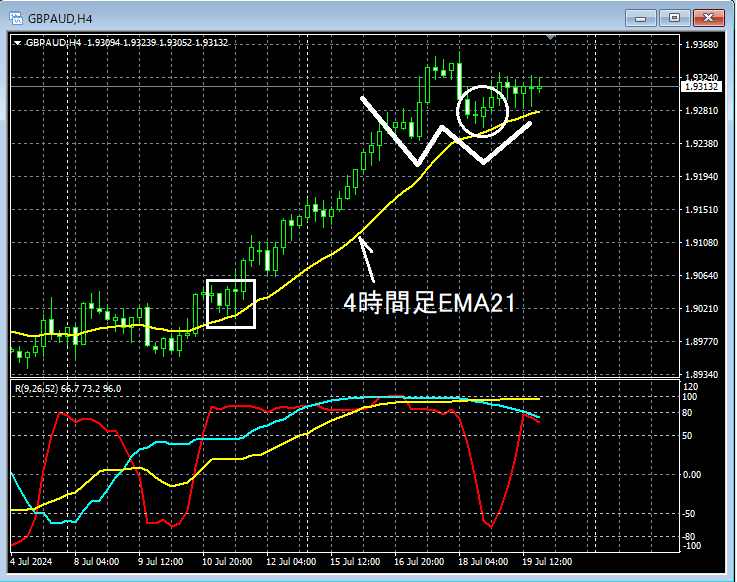
If you look at the area encircled by the white circle on the 4-hour chart above, which previously served as support4-hour EMA21has recently declined again, and it might not be unusual to expect at least a rebound for now. If it rises from here,Double Bottomis formed and it moves upward. Here we will take a closer look at the area encircled by the white circle on a lower timeframe.
Pound AUD 15-minute chart
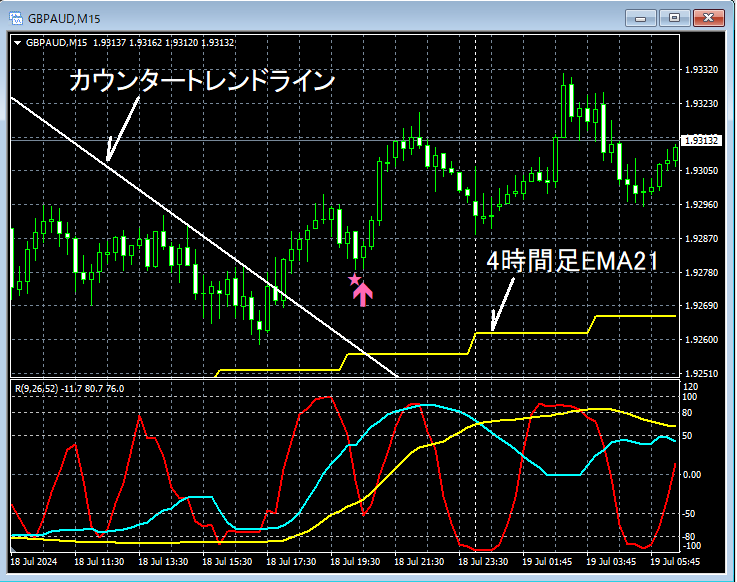
Looking at the 15-minute chart above,4-hour EMA21drops toward and then rebounds.Counter-trend lineis broken to the upside,mBDSR (Filter: RCI26 and RCI52) Buy-the-Dip signallights up and causes a large rise.
From this example,trading method focusing on Double Bottoms and Counter-trend linesandthe harmony with mBDSR signalsare evident.
Also in this example,a stop loss slightly below the recent lowallows for a favorable risk-reward trade.
Indicator that shines in combination with RCI: 【BODSOR・mBDSR】
Methods and Case Study (PDF) ★GogoJungle AWARD2020 winner★
https://www.gogojungle.co.jp/tools/indicators/11836
The PDF package includes 301 files (over 1,000 pages, over 350,000 characters in total).
Most of them are aboutlinking higher and lower timeframes logically using three RCI lines to examine multiple lower-timeframe conditions sequentially, ultimately waiting for the lower timeframe’s dip buying or pullback selling timing (i.e., mBDSR signals).
Additionally,many focus on identifying points where multiple entry reasons converge.
In the explanations,over 1,000 chartsare used.

Methods and Case Study (PDF) ★GogoJungle AWARD2020 winner★
https://www.gogojungle.co.jp/tools/indicators/11836
The above product includes 301 PDFs. For a list of the PDF titles and related details, please see the article below.
About the 301 PDF files included with 【BODSOR・mBDSR】
https://www.gogojungle.co.jp/finance/navi/articles/34271
Pound AUD 4-hour chart
If you look at the area encircled by the white circle on the 4-hour chart above, which previously served as support4-hour EMA21has recently declined again, and it might not be unusual to expect at least a rebound for now. If it rises from here,Double Bottomis formed and it moves upward. Here we will take a closer look at the area encircled by the white circle on a lower timeframe.
Pound AUD 15-minute chart
Looking at the 15-minute chart above,4-hour EMA21drops toward and then rebounds.Counter-trend lineis broken to the upside,mBDSR (Filter: RCI26 and RCI52) Buy-the-Dip signallights up and causes a large rise.
From this example,trading method focusing on Double Bottoms and Counter-trend linesandthe harmony with mBDSR signalsare evident.
Also in this example,a stop loss slightly below the recent lowallows for a favorable risk-reward trade.
Indicator that shines in combination with RCI: 【BODSOR・mBDSR】
Methods and Case Study (PDF) ★GogoJungle AWARD2020 winner★
https://www.gogojungle.co.jp/tools/indicators/11836
The PDF package includes 301 files (over 1,000 pages, over 350,000 characters in total).
Most of them are aboutlinking higher and lower timeframes logically using three RCI lines to examine multiple lower-timeframe conditions sequentially, ultimately waiting for the lower timeframe’s dip buying or pullback selling timing (i.e., mBDSR signals).
Additionally,many focus on identifying points where multiple entry reasons converge.
In the explanations,over 1,000 chartsare used.
× ![]()


