

Moving Average, Double Bottom, Counter Trend Line, and mBDSR (RCI two-filter) Buy Signal on Pullback (1)
Indicator to Capture Tops and Reversals in Combination with RCI: 【mBDSR】
Methods, Case Studies (PDF) ★GogoJungle AWARD2020 Winner★
https://www.gogojungle.co.jp/tools/indicators/11836
The above products include 301 PDFs. For lists of the titles of those PDFs and other details, please see the article below.
About the 301 PDF files included with 【BODSOR・mBDSR】
https://www.gogojungle.co.jp/finance/navi/articles/34271
GBPNZD 4-hour chart
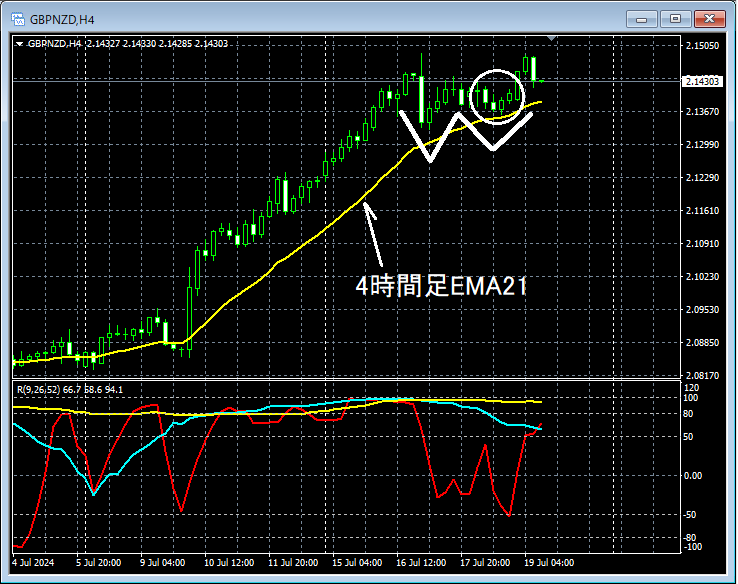
If you look at the area circled with a white circle on the above 4-hour chart, it has dropped to nearthe EMA21 on the 4-hour chartand it may be reasonable to expect at least a rebound for the moment. If it rises from here,a Double Bottommay form and push higher. Here, we will look more closely at the area circled with the white circle on a lower time frame.
GBPNZD 15-minute chart
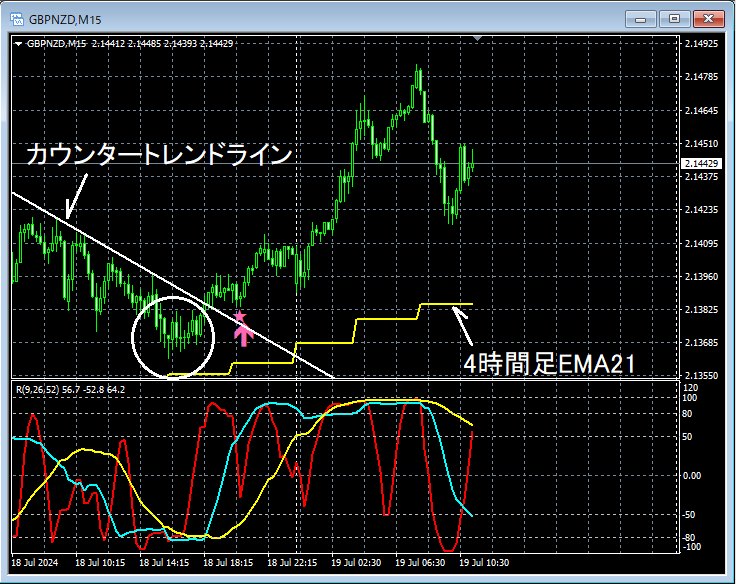
Looking at the 15-minute chart above,the EMA21 on the 4-hour chartdrops to and rebounds from around there.After breaking above the Counter-Trade Lineand then pulling back,mBDSR (Filter: RCI26 and RCI52) Buy-the-Dip signallights up and climbs significantly.
Here, for reference, we will also look at the area circled with the white circle on the above 15-minute chart in a lower time frame (5-minute chart).
GBPNZD 5-minute chart
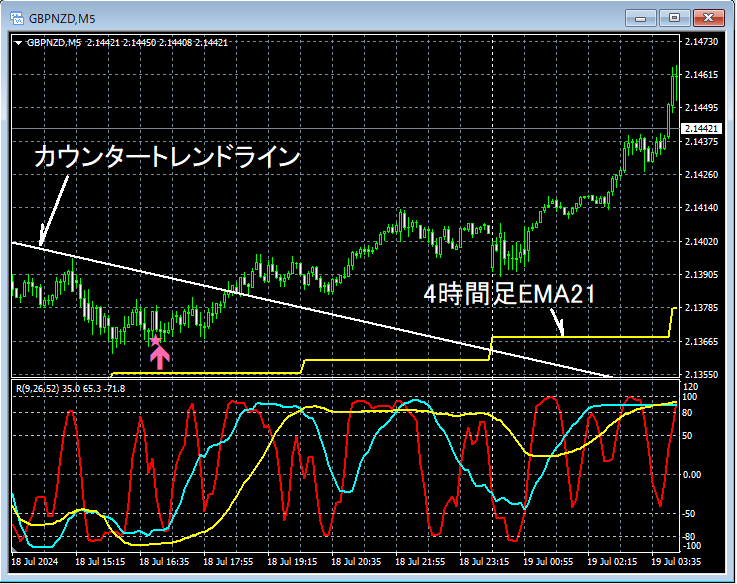
Looking at the above 5-minute chart,the Counter-Trade Lineis broken above beforemBDSR (Filter: RCI26 and RCI52) Buy-the-Dip signallights up and rises sharply.
From this example,the high compatibility between a trading method focused on Double Tops and Counter-Trade Linesandthe signals of mBDSRis evident.
Additionally, in this example, placing a stop slightly below the recent low can yield a favorable risk-reward trade.
Indicator that shines in combination with RCI: 【BODSOR・mBDSR】
Methods, Case Studies (PDF) ★GogoJungle AWARD2020 Winner★
https://www.gogojungle.co.jp/tools/indicators/11836
PDF files total 301 (over 1,000 pages, over 350,000 characters in total).
Most of them are about summarizing how using three RCI lines to logically link higher and lower time frames allows one to sequentially analyze multiple lower-time-frame conditions and finally wait for pullbacks or reversals in the lower time frame signals (i.e., mBDSR signals).
Also,many of them focus on capturing points where multiple entry reasons overlap..
The explanations usemore than 1,000 chartsin total.

Methods, Case Studies (PDF) ★GogoJungle AWARD2020 Winner★
https://www.gogojungle.co.jp/tools/indicators/11836
The above products include 301 PDFs. For lists of the titles of those PDFs and other details, please see the article below.
About the 301 PDF files included with 【BODSOR・mBDSR】
https://www.gogojungle.co.jp/finance/navi/articles/34271
GBPNZD 4-hour chart
If you look at the area circled with a white circle on the above 4-hour chart, it has dropped to nearthe EMA21 on the 4-hour chartand it may be reasonable to expect at least a rebound for the moment. If it rises from here,a Double Bottommay form and push higher. Here, we will look more closely at the area circled with the white circle on a lower time frame.
GBPNZD 15-minute chart
Looking at the 15-minute chart above,the EMA21 on the 4-hour chartdrops to and rebounds from around there.After breaking above the Counter-Trade Lineand then pulling back,mBDSR (Filter: RCI26 and RCI52) Buy-the-Dip signallights up and climbs significantly.
Here, for reference, we will also look at the area circled with the white circle on the above 15-minute chart in a lower time frame (5-minute chart).
GBPNZD 5-minute chart
Looking at the above 5-minute chart,the Counter-Trade Lineis broken above beforemBDSR (Filter: RCI26 and RCI52) Buy-the-Dip signallights up and rises sharply.
From this example,the high compatibility between a trading method focused on Double Tops and Counter-Trade Linesandthe signals of mBDSRis evident.
Additionally, in this example, placing a stop slightly below the recent low can yield a favorable risk-reward trade.
Indicator that shines in combination with RCI: 【BODSOR・mBDSR】
Methods, Case Studies (PDF) ★GogoJungle AWARD2020 Winner★
https://www.gogojungle.co.jp/tools/indicators/11836
PDF files total 301 (over 1,000 pages, over 350,000 characters in total).
Most of them are about summarizing how using three RCI lines to logically link higher and lower time frames allows one to sequentially analyze multiple lower-time-frame conditions and finally wait for pullbacks or reversals in the lower time frame signals (i.e., mBDSR signals).
Also,many of them focus on capturing points where multiple entry reasons overlap..
The explanations usemore than 1,000 chartsin total.
× ![]()


