

Past resistance lines and support-turned-resistance and mBDSR (RCI2 dual-filter) pullback buy signal
Indicator that captures “tops and bottoms and reversals” in combination with RCI: 【mBDSR】
Methods and Case Studies (PDF) ★GogoJungle AWARD2020 Winner★
https://www.gogojungle.co.jp/tools/indicators/11836
The above products include 301 PDFs (methods, case studies, etc.). For a list of the titles of those PDFs, please see the article below.
【About the 301 attached PDFs for BODSOR and mBDSR】
https://www.gogojungle.co.jp/finance/navi/articles/34271
USD/CAD 1-hour chart
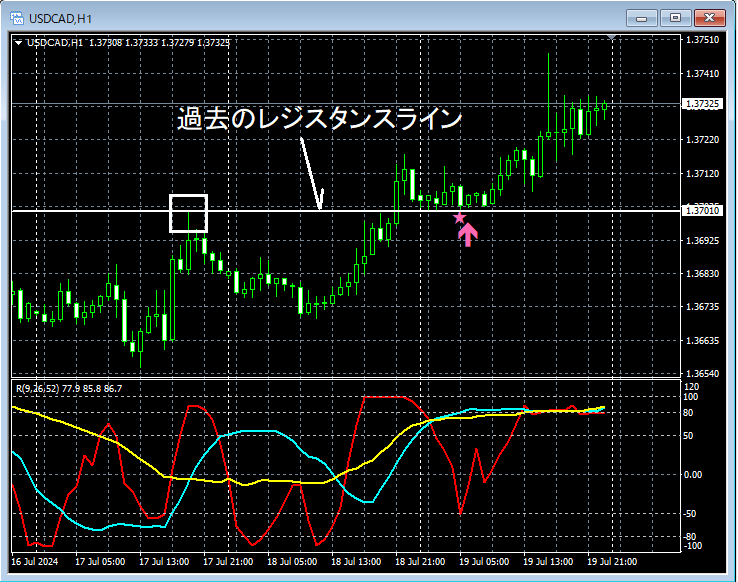
On the above 1-hour chart,the line that previously acted as resistancenearbymBDSR (filters: RCI26 and RCI52) buy-the-dip signalslight up, and subsequently, the price has risen smoothly.
From this example,a trading method focused on lines that previously acted as resistanceandthe signals of mBDSRshow a strong compatibility.
Indicator that shines in combination with RCI: 【BODSOR・mBDSR】
Methods and Case Studies (PDF) ★GogoJungle AWARD2020 Winner★
https://www.gogojungle.co.jp/tools/indicators/11836
PDF files come with 301 attachments.
Many of them are compiled as examples that logically link higher and lower timeframes by using three RCI lines, examining multiple lower-timeframe conditions in sequence, and finally waiting for pullback buying or pullback selling timings (i.e., mBDSR signals) on the lower timeframe..
Also,there is a strong emphasis on capturing points where multiple entry reasons coincide.
The explanations useover 1,000 charts in total.

Methods and Case Studies (PDF) ★GogoJungle AWARD2020 Winner★
https://www.gogojungle.co.jp/tools/indicators/11836
The above products include 301 PDFs (methods, case studies, etc.). For a list of the titles of those PDFs, please see the article below.
【About the 301 attached PDFs for BODSOR and mBDSR】
https://www.gogojungle.co.jp/finance/navi/articles/34271
USD/CAD 1-hour chart
On the above 1-hour chart,the line that previously acted as resistancenearbymBDSR (filters: RCI26 and RCI52) buy-the-dip signalslight up, and subsequently, the price has risen smoothly.
From this example,a trading method focused on lines that previously acted as resistanceandthe signals of mBDSRshow a strong compatibility.
Indicator that shines in combination with RCI: 【BODSOR・mBDSR】
Methods and Case Studies (PDF) ★GogoJungle AWARD2020 Winner★
https://www.gogojungle.co.jp/tools/indicators/11836
PDF files come with 301 attachments.
Many of them are compiled as examples that logically link higher and lower timeframes by using three RCI lines, examining multiple lower-timeframe conditions in sequence, and finally waiting for pullback buying or pullback selling timings (i.e., mBDSR signals) on the lower timeframe..
Also,there is a strong emphasis on capturing points where multiple entry reasons coincide.
The explanations useover 1,000 charts in total.
× ![]()


