

Reversal sell signals for double tops and mbDSR (RCI two-filter) in the neckline, upper timeframe, and lower timeframe
Indicator that captures “top/bottom and reversal” with RCI combination【mBDSR】
and method & case studies (PDF) ★GogoJungle AWARD2020 winner★
https://www.gogojungle.co.jp/tools/indicators/11836
The above product includes 301 PDFs (methods, case studies, etc.). For a list of the titles of those PDFs, please see the article below.
About the 301 PDF files included with 【BODSOR・mBDSR】
https://www.gogojungle.co.jp/finance/navi/articles/34271
NZD/CAD Daily
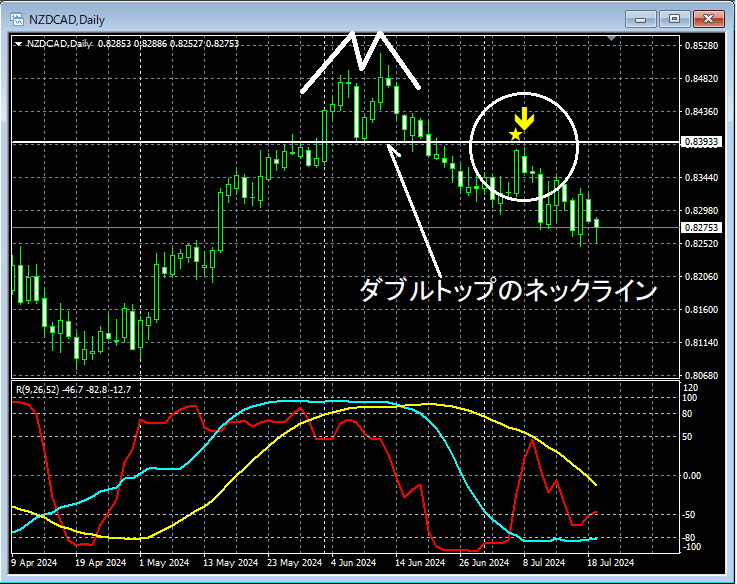
On the above daily chart,the neck line of the double tophas risen close to it.mBDSR (two RCI filters) rebound sell signalis lit and as a result the price has fallen steadily, but here we will take a closer look at the area circled in white (the chart movement right after the signal lights) on a lower time frame.
NZD/CAD 30-minute
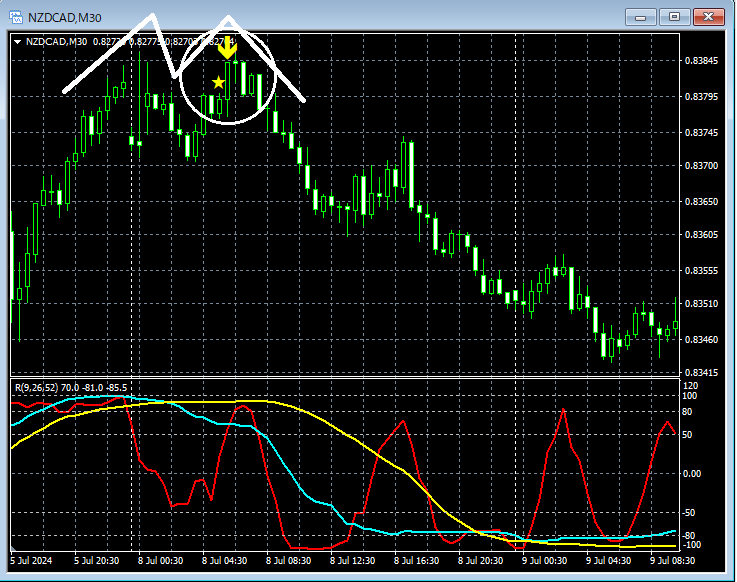
On the 30-minute chart above,the area that could become the right peak of the double toparound whichmBDSR (two RCI filters) rebound sell signallights up and, as a result, falls firmly, but here we will examine in more detail the area circled in white (the chart movement right after the signal lights) on a lower time frame.
NZD/CAD 5-minute
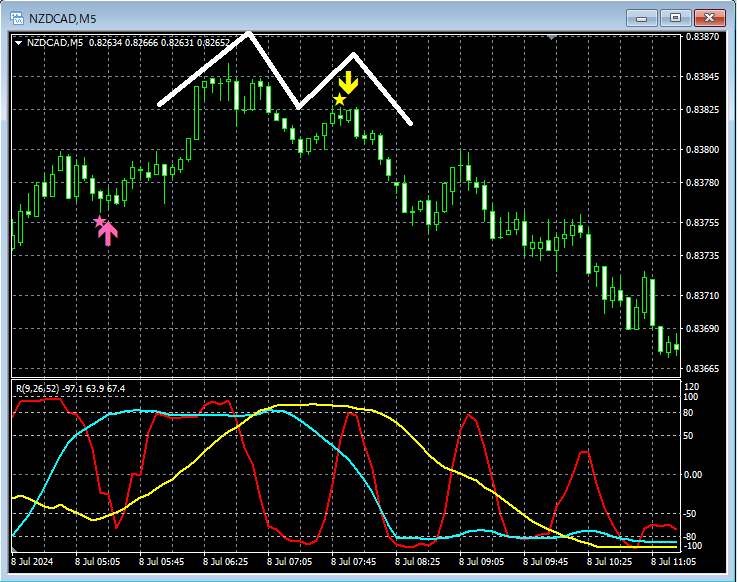
Watching the price action on the 5-minute chart above,the mBDSR (two RCI filters) rebound sell signallights up and drops sharply. Consequently,the right peak of the double topshowsmBDSR (two RCI filters) rebound sell signallighting up.
From this example,a trading method focused on double tops and neck linesandthe signals of mBDSRshow strong coherence.
Additionally, in this example, placing the stop loss slightly above the left peak of the double top (recent high) on the 5-minute chartenables good risk-reward trading.
The indicator that shines in combination with RCI【BODSOR・mBDSR】
and method & case studies (PDF) ★GogoJungle AWARD2020 winner★
https://www.gogojungle.co.jp/tools/indicators/11836
The PDF files are 301 in total.
Most of them are examples that break down the process of linking higher and lower time frames logically using three RCI lines, sequentially evaluating multiple lower time frames, and ultimately waiting for pullback buys or pullback sells on the lower time frames (i.e., the mBDSR signals).Additionally,
many of them emphasize capturing points where multiple entry reasons overlap..
The explanations useover 1,000 charts.

and method & case studies (PDF) ★GogoJungle AWARD2020 winner★
https://www.gogojungle.co.jp/tools/indicators/11836
The above product includes 301 PDFs (methods, case studies, etc.). For a list of the titles of those PDFs, please see the article below.
About the 301 PDF files included with 【BODSOR・mBDSR】
https://www.gogojungle.co.jp/finance/navi/articles/34271
NZD/CAD Daily
On the above daily chart,the neck line of the double tophas risen close to it.mBDSR (two RCI filters) rebound sell signalis lit and as a result the price has fallen steadily, but here we will take a closer look at the area circled in white (the chart movement right after the signal lights) on a lower time frame.
NZD/CAD 30-minute
On the 30-minute chart above,the area that could become the right peak of the double toparound whichmBDSR (two RCI filters) rebound sell signallights up and, as a result, falls firmly, but here we will examine in more detail the area circled in white (the chart movement right after the signal lights) on a lower time frame.
NZD/CAD 5-minute
Watching the price action on the 5-minute chart above,the mBDSR (two RCI filters) rebound sell signallights up and drops sharply. Consequently,the right peak of the double topshowsmBDSR (two RCI filters) rebound sell signallighting up.
From this example,a trading method focused on double tops and neck linesandthe signals of mBDSRshow strong coherence.
Additionally, in this example, placing the stop loss slightly above the left peak of the double top (recent high) on the 5-minute chartenables good risk-reward trading.
The indicator that shines in combination with RCI【BODSOR・mBDSR】
and method & case studies (PDF) ★GogoJungle AWARD2020 winner★
https://www.gogojungle.co.jp/tools/indicators/11836
The PDF files are 301 in total.
Most of them are examples that break down the process of linking higher and lower time frames logically using three RCI lines, sequentially evaluating multiple lower time frames, and ultimately waiting for pullback buys or pullback sells on the lower time frames (i.e., the mBDSR signals).Additionally,
many of them emphasize capturing points where multiple entry reasons overlap..
The explanations useover 1,000 charts.
× ![]()


