

【Crude Oil (WTI)】Moving average, double bottom, counter-trend line, and mBDSR (RCI two-filter) pullback buy signal
Indicator that captures “tops and bottoms and reversals” in combination with RCI: 【mBDSR】
Methods and Case Studies (PDF) ★GogoJungle AWARD2020 Winner★
https://www.gogojungle.co.jp/tools/indicators/11836
The above product includes 301 PDFs. For the list of those PDFs’ titles, please refer to the article below.
About the 301 PDF files accompanying 【BODSOR・mBDSR】
https://www.gogojungle.co.jp/finance/navi/articles/34271
Crude Oil WTI 1-hour chart
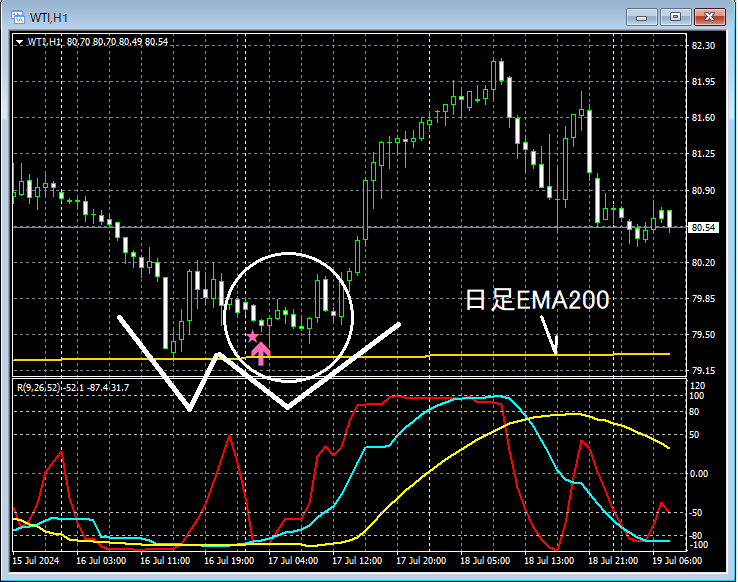
On the above 1-hour chartDaily EMA200acts as supportDouble bottomis formed. Consequentlythe right-hand trough of the double bottomis wheremBDSR (Filter: RCI26 and RCI52) bounce-buy signallights up and the price rises; in this section, we will examine the area encircled in white with a lower time frame.
Crude Oil WTI 15-minute chart
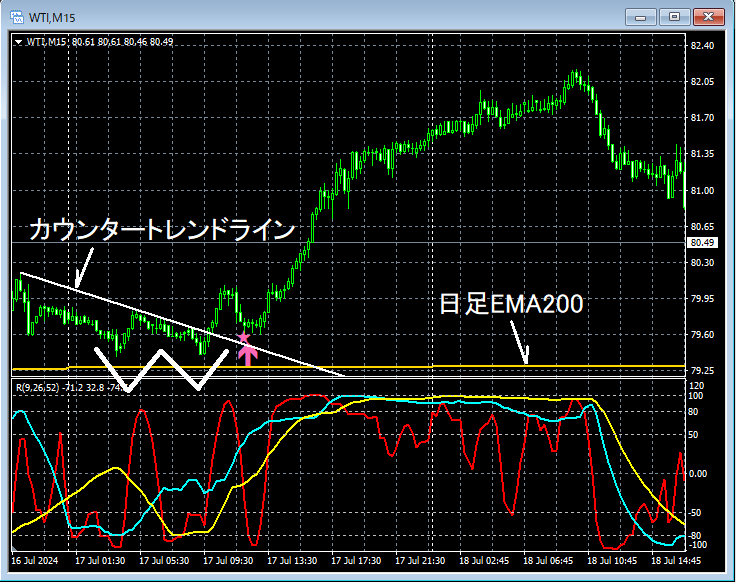
Looking at the 15-minute chart,the right-hand trough of the double bottom on the higher time frame (1-hour)shows thatthe double bottom also forms on the lower time frame (15-minute)after breaking above the counter-trend linethe decline,the mBDSR bounce-buy signallights up and the price rises sharply.
From this example,the trading approach that focuses on doubles bottoms and counter-trend linesandthe signals of mBDSRshow strong compatibility.
Additionally, in this example,the recent lowis slightly exceeded by placing the stop-loss line below it, enabling favorable risk-reward trading.
Indicator that shines in combination with RCI: 【BODSOR・mBDSR】
Methods and Case Studies (PDF) ★GogoJungle AWARD2020 Winner★
https://www.gogojungle.co.jp/tools/indicators/11836
The PDF files include 301 items (over 1,000 pages, over 350,000 characters in total).
Many of them are aboutusing the three RCI lines to logically link higher and lower timeframes, progressively examining multiple lower timeframes, and ultimately waiting for pullbacks in the lower timeframes (i.e., the mBDSR signals) to enter long positions or sell on rallies.
Additionally,many focus on identifying points where multiple entry justifications overlap.
The descriptions useover 1,000 charts.

Methods and Case Studies (PDF) ★GogoJungle AWARD2020 Winner★
https://www.gogojungle.co.jp/tools/indicators/11836
The above product includes 301 PDFs. For the list of those PDFs’ titles, please refer to the article below.
About the 301 PDF files accompanying 【BODSOR・mBDSR】
https://www.gogojungle.co.jp/finance/navi/articles/34271
Crude Oil WTI 1-hour chart
On the above 1-hour chartDaily EMA200acts as supportDouble bottomis formed. Consequentlythe right-hand trough of the double bottomis wheremBDSR (Filter: RCI26 and RCI52) bounce-buy signallights up and the price rises; in this section, we will examine the area encircled in white with a lower time frame.
Crude Oil WTI 15-minute chart
Looking at the 15-minute chart,the right-hand trough of the double bottom on the higher time frame (1-hour)shows thatthe double bottom also forms on the lower time frame (15-minute)after breaking above the counter-trend linethe decline,the mBDSR bounce-buy signallights up and the price rises sharply.
From this example,the trading approach that focuses on doubles bottoms and counter-trend linesandthe signals of mBDSRshow strong compatibility.
Additionally, in this example,the recent lowis slightly exceeded by placing the stop-loss line below it, enabling favorable risk-reward trading.
Indicator that shines in combination with RCI: 【BODSOR・mBDSR】
Methods and Case Studies (PDF) ★GogoJungle AWARD2020 Winner★
https://www.gogojungle.co.jp/tools/indicators/11836
The PDF files include 301 items (over 1,000 pages, over 350,000 characters in total).
Many of them are aboutusing the three RCI lines to logically link higher and lower timeframes, progressively examining multiple lower timeframes, and ultimately waiting for pullbacks in the lower timeframes (i.e., the mBDSR signals) to enter long positions or sell on rallies.
Additionally,many focus on identifying points where multiple entry justifications overlap.
The descriptions useover 1,000 charts.
× ![]()


