

Double top, neckline, and mBDSR (RCI2 two-filter) signal
0
An Indicator that Captures Bottoms and Reversals in Combination with RCI: 【mBDSR】
Methods and Case Studies (PDF) ★GogoJungle AWARD2020 Winner★
https://www.gogojungle.co.jp/tools/indicators/11836
The above product includes 301 PDFs (methods, case studies, etc.). For lists of the PDF titles, please see the article below.
About the 301 PDF files included with 【BODSOR・mBDSR】
https://www.gogojungle.co.jp/finance/navi/articles/34271
AUDUSD 4-Hour Chart
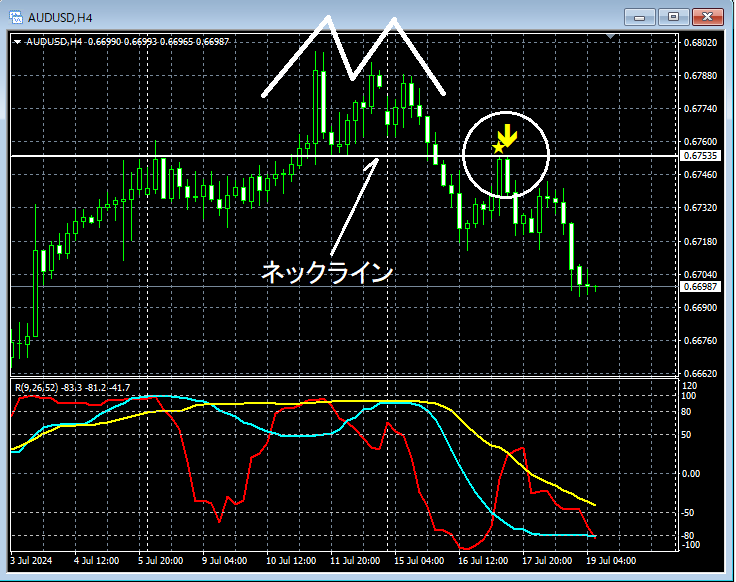
In the above 4-hour chart, near the neck line,mBDSR (RCI two-line filter)signals a pullback sell. Subsequently, the price declines significantly, but here we will take a closer look at the area circled in white on a lower time frame.
AUDUSD 5-Minute Chart
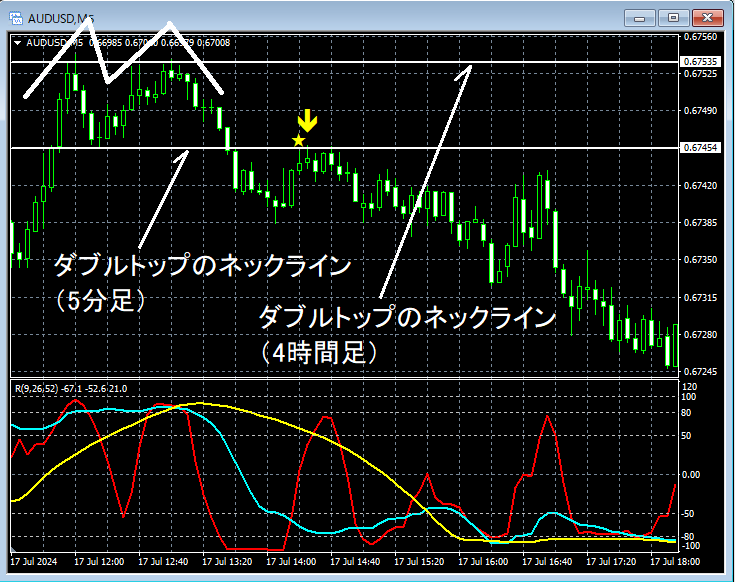
In the above 5-minute chart, near the neck line of the 4-hour chart,Double Topforms and the price declines. Then,the neck line of the Double Topis reachedmBDSR (RCI two-line filter)signals a pullback sell and the price drops sharply.
From this example,the trading approach focused on Double Tops and neck linesandthe signals of mBDSRshow a high level of synergy.
The indicator 【BODSOR・mBDSR】 that shines in combination with RCI
and methods & case studies (PDF) ★GogoJungle AWARD2020 Winner★
https://www.gogojungle.co.jp/tools/indicators/11836
Comes with 301 PDF files.
Many of them are examples that break down the process of using the three-line RCI to logically link higher and lower timeframes, progressively considering the状況 of multiple lower timeframes, and finally waiting for timing to buy on dips or sell on rallies on the lower timeframes (i.e., mBDSR signals).These are compiled in this way.
Additionally,there are many that emphasize catching points where multiple entry reasons overlap..
The explanations useover 1,000 chartsin total.

Methods and Case Studies (PDF) ★GogoJungle AWARD2020 Winner★
https://www.gogojungle.co.jp/tools/indicators/11836
The above product includes 301 PDFs (methods, case studies, etc.). For lists of the PDF titles, please see the article below.
About the 301 PDF files included with 【BODSOR・mBDSR】
https://www.gogojungle.co.jp/finance/navi/articles/34271
AUDUSD 4-Hour Chart
In the above 4-hour chart, near the neck line,mBDSR (RCI two-line filter)signals a pullback sell. Subsequently, the price declines significantly, but here we will take a closer look at the area circled in white on a lower time frame.
AUDUSD 5-Minute Chart
In the above 5-minute chart, near the neck line of the 4-hour chart,Double Topforms and the price declines. Then,the neck line of the Double Topis reachedmBDSR (RCI two-line filter)signals a pullback sell and the price drops sharply.
From this example,the trading approach focused on Double Tops and neck linesandthe signals of mBDSRshow a high level of synergy.
The indicator 【BODSOR・mBDSR】 that shines in combination with RCI
and methods & case studies (PDF) ★GogoJungle AWARD2020 Winner★
https://www.gogojungle.co.jp/tools/indicators/11836
Comes with 301 PDF files.
Many of them are examples that break down the process of using the three-line RCI to logically link higher and lower timeframes, progressively considering the状況 of multiple lower timeframes, and finally waiting for timing to buy on dips or sell on rallies on the lower timeframes (i.e., mBDSR signals).These are compiled in this way.
Additionally,there are many that emphasize catching points where multiple entry reasons overlap..
The explanations useover 1,000 chartsin total.
× ![]()


