

【Bitcoin】 Resistance zone, return high, and mBDSR (RCI 2-signal filter) signals — from today's chart —
0
Indicator that captures “tops bottom and reversals” in combination with RCI【mBDSR】
Methods and case studies (PDF) ★GogoJungle AWARD2020 Winner★
https://www.gogojungle.co.jp/tools/indicators/11836
The above products include 301 PDFs (methods, case studies, etc.). For the list of PDF titles, please see the article below.
About the 301 PDF files included with 【BODSOR・mBDSR】
https://www.gogojungle.co.jp/finance/navi/articles/34271
BTCUSD Bitcoin / US Dollar 1-minute chart
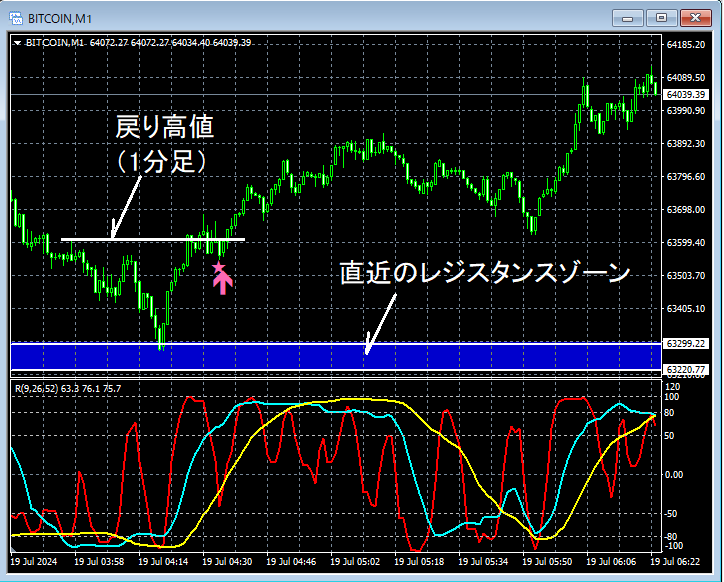
In the 1-minute chart aboveRecent resistance zone (upper-timeframe chart omitted) rebounds near this area, andBreaks above the retracement high then, on pullback, signals ofmBDSR (filters: RCI26 and RCI52) illuminate and rise firmly.
From this example,a trading approach focusing on rebounds from resistance zones and retracement highs andthe signals of mBDSR show high compatibility.
Indicator that shines in combination with RCI: 【BODSOR・mBDSR】
Methods and case studies (PDF) ★GogoJungle AWARD2020 Winner★
https://www.gogojungle.co.jp/tools/indicators/11836
301 PDF files are included.
Many of them aresummaries of examples where logical linking of the higher and lower timeframes is done using three RCI lines, examining multiple lower-timeframe conditions step by step, and finally waiting for pullbacks to buy on dips or sell on rallies (i.e., mBDSR signals)..
Also,many focus on identifying points where multiple entry reasons overlap..
The explanation usesmore than 1,000 charts in total..

Methods and case studies (PDF) ★GogoJungle AWARD2020 Winner★
https://www.gogojungle.co.jp/tools/indicators/11836
The above products include 301 PDFs (methods, case studies, etc.). For the list of PDF titles, please see the article below.
About the 301 PDF files included with 【BODSOR・mBDSR】
https://www.gogojungle.co.jp/finance/navi/articles/34271
BTCUSD Bitcoin / US Dollar 1-minute chart
In the 1-minute chart aboveRecent resistance zone (upper-timeframe chart omitted) rebounds near this area, andBreaks above the retracement high then, on pullback, signals ofmBDSR (filters: RCI26 and RCI52) illuminate and rise firmly.
From this example,a trading approach focusing on rebounds from resistance zones and retracement highs andthe signals of mBDSR show high compatibility.
Indicator that shines in combination with RCI: 【BODSOR・mBDSR】
Methods and case studies (PDF) ★GogoJungle AWARD2020 Winner★
https://www.gogojungle.co.jp/tools/indicators/11836
301 PDF files are included.
Many of them aresummaries of examples where logical linking of the higher and lower timeframes is done using three RCI lines, examining multiple lower-timeframe conditions step by step, and finally waiting for pullbacks to buy on dips or sell on rallies (i.e., mBDSR signals)..
Also,many focus on identifying points where multiple entry reasons overlap..
The explanation usesmore than 1,000 charts in total..
× ![]()


