

Bitcoin Double Top, Neck Line, and mBDSR (RCI2 Filter) Signal — From Yesterday's Chart —
0
An indicator that captures “tops/bottoms and reversals” in combination with RCI【mBDSR】
and method & case studies (PDF) ★GogoJungle AWARD2020 Winner★
https://www.gogojungle.co.jp/tools/indicators/11836
The above products include 301 PDFs (methods, case studies, etc.). For the list of the PDF titles, please see the article below.
About the 301 PDF files included with 【BODSOR・mBDSR】
https://www.gogojungle.co.jp/finance/navi/articles/34271
BTCUSD Bitcoin / US Dollar 15-minute chart
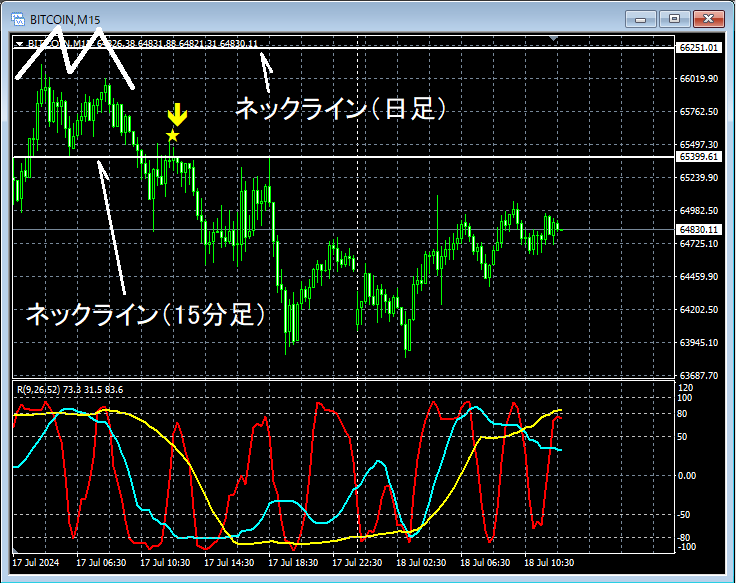
Although the daily chart is omitted, on the above 15-minute chart, after rising close to the daily neck linea Double Topwas formed and fell. Then, after rising to near theDouble Top Neck Linelevel,mBDSR (Filter: RCI26 and RCI52)signal to short came on and pushed prices down sharply.
From this example,the trade method focusing on double tops and neck linesandthe signals of mBDSRshow a strong synergy.
Indicator that shines when combined with RCI【BODSOR・mBDSR】
and method & case studies (PDF) ★GogoJungle AWARD2020 Winner★
https://www.gogojungle.co.jp/tools/indicators/11836
301 PDF files are included.
Many of them aresummaries of how to logically link the higher timeframe with the lower timeframe using three RCI lines, analyze multiple lower timeframes sequentially, and ultimately wait for timing to buy on dips or sell on rallies on the lower timeframes (i.e., mBDSR signals)..
Additionally,many focus on capturing points where multiple entry reasons align..
In explanations,over 1,000 chartshave been used.

and method & case studies (PDF) ★GogoJungle AWARD2020 Winner★
https://www.gogojungle.co.jp/tools/indicators/11836
The above products include 301 PDFs (methods, case studies, etc.). For the list of the PDF titles, please see the article below.
About the 301 PDF files included with 【BODSOR・mBDSR】
https://www.gogojungle.co.jp/finance/navi/articles/34271
BTCUSD Bitcoin / US Dollar 15-minute chart
Although the daily chart is omitted, on the above 15-minute chart, after rising close to the daily neck linea Double Topwas formed and fell. Then, after rising to near theDouble Top Neck Linelevel,mBDSR (Filter: RCI26 and RCI52)signal to short came on and pushed prices down sharply.
From this example,the trade method focusing on double tops and neck linesandthe signals of mBDSRshow a strong synergy.
Indicator that shines when combined with RCI【BODSOR・mBDSR】
and method & case studies (PDF) ★GogoJungle AWARD2020 Winner★
https://www.gogojungle.co.jp/tools/indicators/11836
301 PDF files are included.
Many of them aresummaries of how to logically link the higher timeframe with the lower timeframe using three RCI lines, analyze multiple lower timeframes sequentially, and ultimately wait for timing to buy on dips or sell on rallies on the lower timeframes (i.e., mBDSR signals)..
Additionally,many focus on capturing points where multiple entry reasons align..
In explanations,over 1,000 chartshave been used.
× ![]()


