

上位足のダブルトップの右側の山で形成された下位足のダブルトップとmBDSR(RCI2本フィルター)のサイン
0
Indicator that captures “tops and bottoms and reversals” in combination with RCI【mBDSR】
Methods and Case Studies (PDF) ★GogoJungle AWARD2020 winner★
https://www.gogojungle.co.jp/tools/indicators/11836
The above products include 301 PDFs (methods, case studies, etc.). For a list of the titles of those PDFs, please refer to the article below.
About the 301 PDF files included with 【BODSOR・mBDSR】
https://www.gogojungle.co.jp/finance/navi/articles/34271
Aussie Swiss Daily
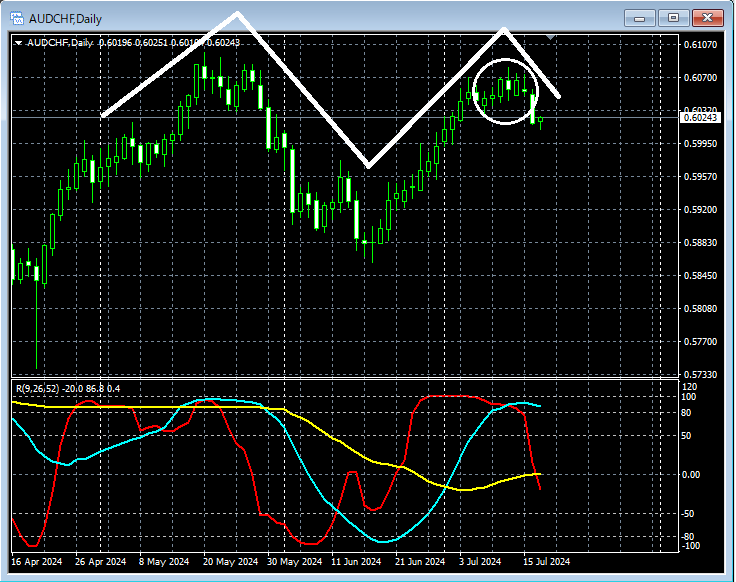
In the above daily chart,the previous highhas risen close to it.The zone near the previous highis likely to act as resistance, and until a clear breakout above it occurs, it may be reasonable to look for selling on rallies.
Here on the daily chart,a double topmay form, so we will also look more closely at lower timeframes around the area encircled by the white circle.
Aussie Swiss 4-hour
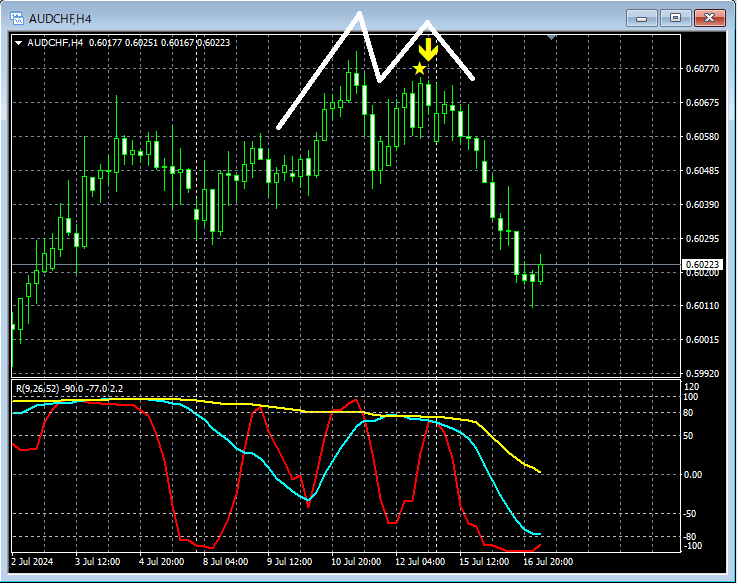
Watching the 4-hour chart above, around the area that could become the right-hand peak of a double top on the daily chart,mBDSR (two-RCI filter) sell signallights up and the price falls. As a result, on the 4-hour chart theright peak of the double topshows themBDSR (two-RCI filter) sell signallighting up.
From this example,a trading method focused on the double topand thesignal from mBDSRshow a high degree of compatibility.
Also in this example, by placing a stop slightly above theleft peak of the double top (recent high)on the 4-hour chart,a trade with a favorable risk-reward can be achieved.Indicator that shines when combined with RCI: 【BODSOR・mBDSR】Methods and Case Studies (PDF) ★GogoJungle AWARD2020 winner★https://www.gogojungle.co.jp/tools/indicators/11836The PDF files include 301 items.Many of them are studies that logically link higher and lower timeframes using three RCI lines, examining the status of multiple lower timeframes in sequence, and ultimately waiting for pullback buys or pullback sells on lower timeframes (i.e., mBDSR signals).Additionally,many are focused on capturing points where multiple entry reasons overlap..The explanations useover 1,000 charts.
Indicator that shines when combined with RCI: 【BODSOR・mBDSR】
Methods and Case Studies (PDF) ★GogoJungle AWARD2020 winner★
https://www.gogojungle.co.jp/tools/indicators/11836
The PDF files include 301 items.
Many of them are studies that logically link higher and lower timeframes using three RCI lines, examining the status of multiple lower timeframes in sequence, and ultimately waiting for pullback buys or pullback sells on lower timeframes (i.e., mBDSR signals).
Additionally,many are focused on capturing points where multiple entry reasons overlap..
The explanations useover 1,000 charts.

Methods and Case Studies (PDF) ★GogoJungle AWARD2020 winner★
https://www.gogojungle.co.jp/tools/indicators/11836
The above products include 301 PDFs (methods, case studies, etc.). For a list of the titles of those PDFs, please refer to the article below.
About the 301 PDF files included with 【BODSOR・mBDSR】
https://www.gogojungle.co.jp/finance/navi/articles/34271
Aussie Swiss Daily
In the above daily chart,the previous highhas risen close to it.The zone near the previous highis likely to act as resistance, and until a clear breakout above it occurs, it may be reasonable to look for selling on rallies.
Here on the daily chart,a double topmay form, so we will also look more closely at lower timeframes around the area encircled by the white circle.
Aussie Swiss 4-hour
Watching the 4-hour chart above, around the area that could become the right-hand peak of a double top on the daily chart,mBDSR (two-RCI filter) sell signallights up and the price falls. As a result, on the 4-hour chart theright peak of the double topshows themBDSR (two-RCI filter) sell signallighting up.
From this example,a trading method focused on the double topand thesignal from mBDSRshow a high degree of compatibility.
Also in this example, by placing a stop slightly above theleft peak of the double top (recent high)on the 4-hour chart,a trade with a favorable risk-reward can be achieved.Indicator that shines when combined with RCI: 【BODSOR・mBDSR】Methods and Case Studies (PDF) ★GogoJungle AWARD2020 winner★https://www.gogojungle.co.jp/tools/indicators/11836The PDF files include 301 items.Many of them are studies that logically link higher and lower timeframes using three RCI lines, examining the status of multiple lower timeframes in sequence, and ultimately waiting for pullback buys or pullback sells on lower timeframes (i.e., mBDSR signals).Additionally,many are focused on capturing points where multiple entry reasons overlap..The explanations useover 1,000 charts.
Indicator that shines when combined with RCI: 【BODSOR・mBDSR】
Methods and Case Studies (PDF) ★GogoJungle AWARD2020 winner★
https://www.gogojungle.co.jp/tools/indicators/11836
The PDF files include 301 items.
Many of them are studies that logically link higher and lower timeframes using three RCI lines, examining the status of multiple lower timeframes in sequence, and ultimately waiting for pullback buys or pullback sells on lower timeframes (i.e., mBDSR signals).
Additionally,many are focused on capturing points where multiple entry reasons overlap..
The explanations useover 1,000 charts.
× ![]()


